
INDICATOR SUMMARY: Our Seasonal Timing Strategy (STS) is in its favorable season, (entry signal for the favorable season October 24), but we have taken our profits on it temporarily, expecting a market correction. Our non-seasonal market-timing strategy triggered a sell signal Friday, Feb. 3 on the overall U.S. market, the energy sector, and the Japanese market. Our gold indicators remain on a sell signal. Our bond indicators are neutral.
March 22, 2006.
Conditions that pushed the market to significant declines in the past have been in place awhile, but have not affected the market. When that happens ‘crowd think’ becomes that they no longer matter. Think Japan in 1989, when the Nikkei had been defying its low dividend yield long enough to have investors claiming, as Ned Davis warned at the time, that “Dividends no longer matter.”
Think the U.S. market in 1999, when ‘irrational exuberance’ had the market selling at record P/E ratios, prompting Wall Street to assure investors “price/earnings ratios no longer matter”, that we needed to think in terms of price/sales. Currently we have had the budget, trade, and current account deficits hitting record levels for so long, without them affecting the market, that a substantial ‘deficits don’t matter’ crowd has developed. An article in Barron’s this week includes this regarding the presidential cycle, “Some graybeards keep repeating that the second year of a presidential term usually involves the market hitting an air pocket.”
The presidential cycle no longer matters?
Is that because almost three months of the 2nd year of this term have passed without the market experiencing a problem yet? Maybe we better look at the last 50 years of the presidential cycle via charts.
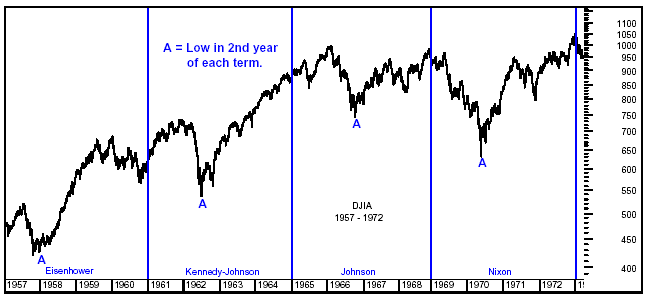
1957 – 1972. This period encompassed half of the secular bull market of 1949-1966; half of the secular bear market of 1966-1982; eight years with Republicans in the White House, eight years with Democrats; peace and war, boom times and bust. What didn’t change? Bear markets, with lows in the 2nd year of each term.
1973 - 1989. An interesting observation about this period: There were significant lows in the second year of the Nixon-Ford, Carter, and Reagan first term, but not in the Reagan second term.
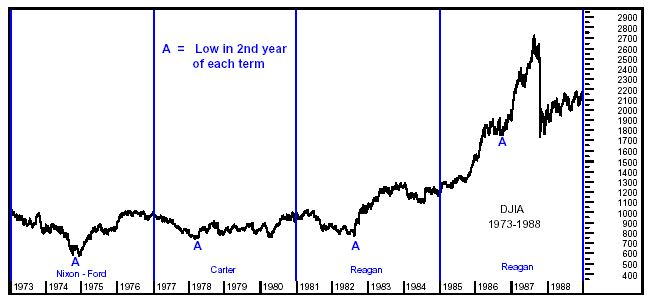
The Four-Year Presidential Cycle is created by the efforts of every Administration to have the economy and stock market in great shape by the time the next election rolls around. Therefore, all the stops are pulled out in the 2nd and 3rd years of each term (in the form of tax cuts, interest rate cuts, heavy Federal spending to create jobs, etc.), to assure that outcome. Unfortunately by the time of the next election, those stimulus efforts have resulted in excesses (in the form of a price bubble in one asset class or another, an overheated economy, rising inflation, excessive federal, consumer, corporate debt, or whatever) that need to be corrected. Those excesses are allowed to correct in the first two years of the next term, so there will be plenty of time to again re-stimulate the economy in time for the following election. If market forces do not correct the excesses on their own, the corrections are brought about by raising interest rates, cutting Federal spending, etc. The political fear is of just what happened to the Reagan Administration in its second term, when it apparently thought it could keep everything rolling through its second term, all the way to the next election without an intervening correction in the first half of the term. But that just allowed the excesses to become greater, resulting in a mini-bubble in stock prices and the 1987 crash in the 3rd year of the term.
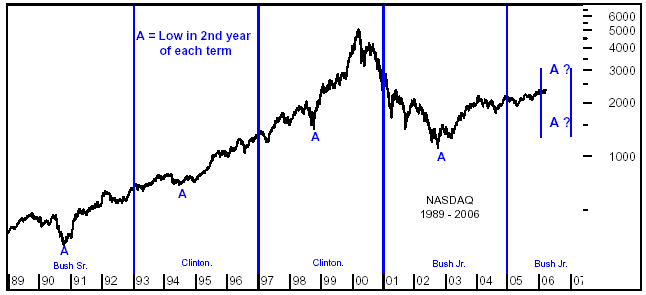
We chose the Nasdaq for the chart of 1989 - 2006, as by then it had become the favorite investing area of investors. If we went back to at least 1918, we would find similar patterns of significant market lows in the 2nd year of the presidential cycle. So this graybeard will continue to “keep repeating that the second year of a presidential term usually involves the market hitting an air pocket.”
The current Presidential Cycle:
So far the Bush Administration has followed the cycle in classic form, a recession and severe market decline in 2001 and 2002, the first two years of its first term, with the Administration doing little about it except to assure the nation that “the U.S. economy is resilient and will bounce back”. However, in 2002 and 2003 the largest economic stimulus package ever to come out of Washington, was introduced, involving tax rebates,
tax cuts, big increases in government spending, and aggressively lowered interest rates.
As called for by the presidential cycle, the stimulus package provided a recovered economy and new bull market in the second half of the term, in time for the election. However, as also called for by the cycle, by election time the stimulus package had created the current excesses; an over-valued stock market, an economy creating inflation, record budget deficits, record consumer debt, an asset bubble (this time in real estate), which need to be corrected. And Washington is trying to achieve a correction of at least some of those excesses. The Fed has been raising interest rates since 2004. The Administration is sayingit will cut government spending (the stated goal being to cut the federal deficit in half).
There have been 14 interest rate hikes since 2004. They have recently created an inverted yield curve, the classic warning that a recession lies ahead. But new Fed Chairman Ben Bernanke said very clearly in his speech Monday that he is not worried that an inverted yield curve usually leads to a recession, that this time will be different, and indicated the Fed will continue to raise rates.
The Fed is obviously determined to correct the excesses, including those represented by the real estate bubble, excessive consumer spending, lack of consumer saving, threat of inflation, etc., even if it risks a recession.
Interest rates are doing the job. It takes six months to a year for interest-rate changes to filter in and affect the economy. So by the time the Fed receives confirmation it has done enough, its latest rate moves (those of the last six months to a year) are still in the pipeline. The result is that when cutting rates to stimulate a slowed economy, the Fed usually overshoots and creates an over-heated economy.
When raising rates to slow a strong economy, striving for a ’soft landing’, it usually goes too far and sends the economy into recession. For that reason, as well as that higher interest rates slow consumer spending and raise borrowing costs for corporations, the stock market hates rising interest rates. It has rolled over into corrections as a result of higher rates alone so often that it led to the old stock market maxim “Three Steps Brings a Stumble”. That is, historically when the Fed raised rates three times in a row, indicating it was serious about slowing the economy, the stock market would soon roll over to the downside. But that old rule does not hold when rates have previously been brought to a very low base before the rate hikes begin.
In its last stimulus mode (to bring the economy out of the 2001 recession) the Fed lowered the Fed Fund’s rate to a 45-year low of just 1%. So the stock market has managed to hold up this time even under the onslaught of 14 rate hikes over the last 20 months, since in spite of the hikes, interest rates remained low. (Even so, the market has not been able to go much of anywhere but sideways since 2004, when the Fed began hiking rates). We predicted several times since the hikes began that they were unlikely to have an effect until the Fed Funds rate reached 5% to 6%. That is the lowest level at which the Fed was ever satisfied it had done enough, and stopped a series of hikes.
With the expected hike next week, the Fed Funds rate will be at 5% (with a few more to come). Higher mortgage rates are already affecting a slowdown in the real estate market. And it’s beginning to come to investors’ attention that risk-free interest rates on bank CDs are approaching 5%. Coming at a time when the Dow just came off a year when it was down 0.6%, following a year (2004) when it rose only 3.6%, those rates begin to give the stock market competition, and also lead to the goal of increasing the nation’s level of savings. So what will be the extra effect of the rate hikes already in the pipeline, and those yet to come?
Graybeard or not, we continueto warn that this is not a time to take even normal market risk, with gains soon more likely to come from downside positioning.
Our Seasonal Timing Strategy received its usually timely entry signal on October 24. Its favorable season officially lasts until at least April 20, its earliest exit date, which could be extended to as late as May or June depending on what the MACD indicator is saying when April 20 arrives.
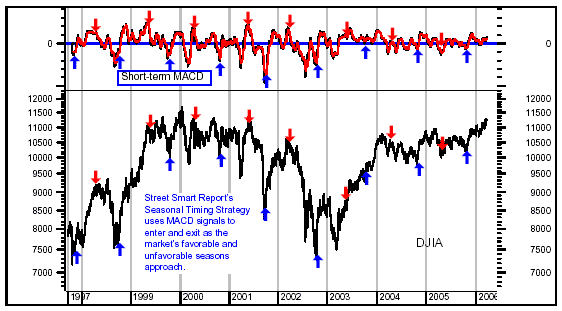
However, due to our expectation of a serious market correction in 2006, we told you we would be taking steps to protect our profits in our STS strategy this year. So, when our non-seasonal Market-Timing Strategy gave a sell signal on Feb. 3, we temporarily took our profits in the STS portfolios. We expected a correction of 10% or so (and still do), which would have wiped out our profit in this flat market, and then a return to the upside for the rest of the favorable season, but with the possibility such a correction could be the beginning of the larger plunge we expect to a low on the Oct./Nov. time frame.
The Dow and S&P 500, moved into a mode of a week or two up, followed by a week or two down, with each move up only managing to reach the trendline resistance that has stopped all the rallies of the last two years, where the brief rallies continued to fail. Through all the short-term fractional volatility, a week and a half ago, the S&P was only 0.5% above where it was when we took our profits. However, a big rally last week, and only a fractional decline so far this week, has it now 2.8% above its level at our exit, and we are getting antsy, as you are.
However, we are continuing to hold the STS portfolios safely on the sidelines collecting interest on cash for the time being, because the odds remain that at least a short-term correction will take place.
The consensus of our intermediate-term technical indicators, which had been mixed and therefore neutral, deteriorated to a sell signal on Feb. 3. As a result we took our profits on most holdings, but did not take downside positioning, waiting until it is more clear whether our sell signal is correct. So far it has not been. The Dow broke out to another new rally high last week, closing at 11,279. But that was only 2.1% higher than its January 11 ‘breakout’ high, and 1.3% higher than its Feb. 22 ‘breakout’, and in fact only 3.1% higher than its March 4 top of last year (see smaller short-term chart below).
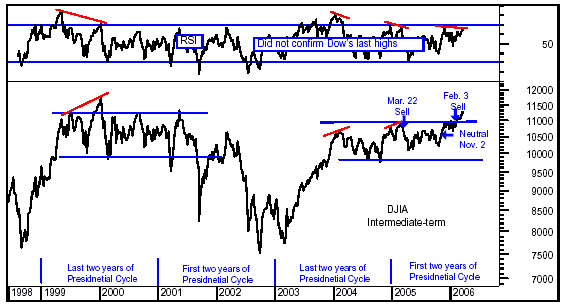
Intermediate-Term. We are sticking with our February 3 sell signal, at least for the moment. Although the ’breakout’ looks significant on the chart, due to the flat market of the last two years, it is not, as noted above.
And many of our technical indicators, including the Dow’s own internal strength (RSI), are not confirming the new highs (they are in negative divergence with the new highs). As marked on the above chart by the red lines, negative divergences are almost always resolved by the market rolling over to the downside. In addition, the DJ Utilities Index, and the tech sector, which frequently lead the overall market in both directions, are also in negative divergences with those indexes like the DJIA and S&P 500 that have been making fractional new highs. And we are in the frequently negative 2nd year of the Four-Year Presidential Cycle. Additionally, with the many fundamental negatives; slowing economic and earnings growth, rising interest rates, a bursting real estate bubble, record consumer debt, etc., it’s difficult to expect much of an upside move unless we can get a correction first.
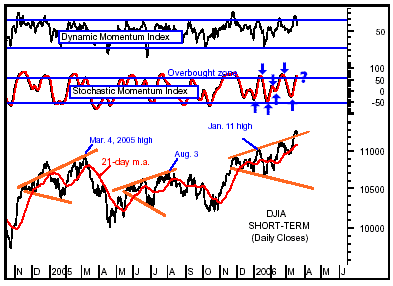
As shown in the short-term chart above, short-term indicators are in overbought territory, and the Dow is shortterm overbought above its 21-day m.a. A short-term correction of overbought conditions could result in a less risky return of the upside through the rest of the favorable seasonal period. The substantial correction we expect to the typical Oct/Nov/ low will set up for the big rally that always takes place from the low in the 2nd year of the Presidential Cycle.
NASDAQ. The consensus of our technical indicators on the Nasdaq also deteriorated further to a sell signal on Feb. 3, and the signal has been increasingly confirmed by the Nasdaq’s action since. But in such a flat market, neither a move to the upside (by the other indexes), or its move to the downside, is conclusive.
Nasdaq 100. We are showing the Nasdaq 100 again this time since it is comprised of the most popular Nasdaq stocks, and also is somewhat of a surrogate for the tech sector, which often leads the market in both directions.
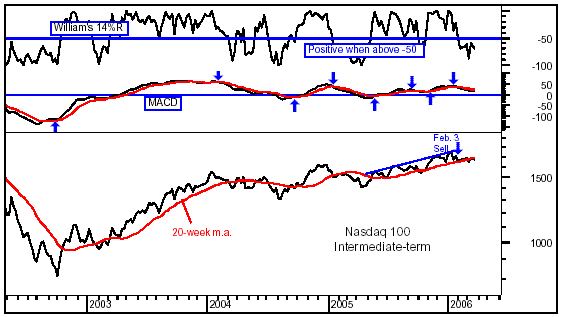
At the market peak on January 11, the Nasdaq 100 failed again at the trendline resistance drawn through its intermediate-term rally peaks. While other major indexes like the Dow and S&P 500 have been able to rally back and make higher highs fractionally above their January 11 peak, the Nasdaq 100 has not been able to do so, but has continued to churn slowly to the downside.
In the process it has already broken below its intermediate-term 20-week m.a., but so far to only a minor degree. However, the technical indicators do remain on sell signals. So the jury is still out on whether this short-term pullback by the Nasdaq 100 will be just a short-term correction, with the upside to soon resume for awhile, or whether it will continue down into the serious correction we expect in the market’s unfavorable season.
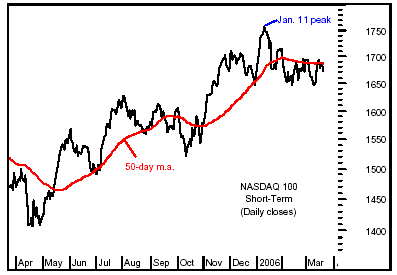
It is unlikely to be the latter unless the rest of the market also resumes its downside action. The Nasdaq may lead the rest of the market down, but it will not go down seriously by itself. The Nasdaq 100 broke below its 50-day moving average in January, as did the other major indexes. But as shown in the short-term chart at left, unlike the other indexes, the Nasdaq 100 has not been able to break back above it. It has tested the overhead resistance at the m.a. several times, and so far has failed each time. Yet the Nasdaq 100 has repeatedly found support at the level of its December low. That support would have to be broken (a lower low), to indicate a real correction has begun.
[THE GOLD SECTOR, BONDS, Japan, and Energy Sector Reserved for Subscribers.]
Sy Harding’s STREET SMART REPORT, Asset Management Research Corp., 505 East New York Ave., Suite 2, DeLand, FL 32724. For subscription service call 1-888-427-3464.
Sorry - A subscription does not include individualized market analysis, or discussions, via phone or e-mail.
STREET SMART REPORT ONLINE (Best buy, much more info at lower price) is updated several times a week, $225 per year. Includes newsletter, hotline updates on-line, plus 8-pages of weekend updates plus online articles and charts on market action, gold, bonds, the economy, Wall Street scams, etc., through the week.
NEWSLETTER BY MAIL is published every 3 weeks and includes telephone hotline updates at 8 P.M. eastern, Wednesday evenings, with additional telephone hotline updates as needed. Subscription: $250 annually.
We take care to assure accuracy of contents but accuracy is not guaranteed. These reports express our opinions, provided solely as a supplement to your own further research. It is each subscriber’s responsibility to decide which, if any, opinions or recommendations are suitable for their situation, and in what manner to use the information. Past performance is not a guarantee of future results.


