

Simplify. Simplify. Simplify. One “simplify” probably would have been enough. I am making the move to focus on one security and am moving my analysis directly to the Nasdaq 100 ETF (QQQQ), S&P 500 ETF (SPY) and Russell 2000 iShares (IWM). I realize that some of you trade NDX, SPX, RUT and the mini’s, but the vast majority of subscribers trade QQQQ, IWM and SPY. These have become the primary trading vehicles and it makes sense to analyze the security that is being traded.
***Position Summary***
The markets responded to bad news with an advance and traders should take notice. QQQQ and SPY managed to hold support and IWM recovered its support break. This is not a great start to the most recent short trades. In addition, breadth is perking up as the 20-day moving averages for AD Volume Net% moved into positive territory. Semis and Software are showing resilience, while Internet and Networking stocks look ripe for at least an oversold bounce. This all adds up to possible strength in the overall market. QQQQ, SPY and IWM peaked with last Friday’s gap and the 5-day trend is down. I remain short, but nervous and will cover on a break above Thursday’s high. I will also use such a move as a bullish trigger to go long. The stop-loss on the current short positions will act as the trigger for longs.
***Previous Day***
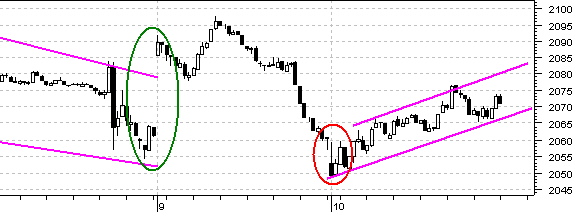
Gaps just ain’t what they used to be. Stocks surged Friday morning as the Nasdaq gapped higher. This gap failed to hold and the index gave it all back in the afternoon. There was a gap down on Thursday morning, but the index recovered and marched higher the entire day. Not a bad performance considering the news and the failure on Thursday. The Russell 2000 and the Nasdaq led the rebound. Six of the nine sectors were up with the Consumer Discretionary and Consumer Staples sectors leading the way (an odd pair). Despite the terrorist threat, the Airline index surged 1.34% and the Dow Transports advanced 1.24%. Perhaps Airlines were focused on the fall in oil. The US Dollar Index moved higher in a flight to quality and this led to weakness in gold.
***Nasdaq 100 ETF (QQQQ)***
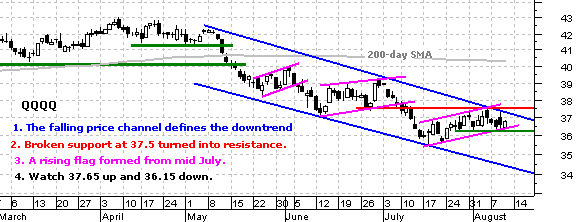
There is no change on the daily chart as QQQQ between the upper channel trendline and flag support. The noose is tightening and a break is imminent. Given the existing downtrend and failures at 37 over the last two weeks, the odds favor a break to the downside and a continuation of the medium-term downtrend. A move to 36.15 would signal a continuation lower and target a move to around 34. Conversely, a move to 37.65 would break resistance and argue for a rally to the 39-40 region.
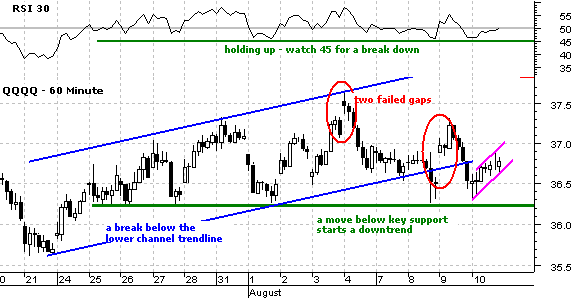
On the 60 minute chart, QQQQ continues to firm near key support at 36.2 and the bulk of the evidence is neutral. RSI finished at 50 and has been trading flat the last 2-3 weeks. The price chart features two failed gaps in the last five days and five bounces off support since 26-July. The bulls cannot hold rallies and the bears cannot push the index below support. The most recent bounce looks like a rising flag (magenta trendlines). A break below the lower trendline would be negative and further weakness below key support would trigger a bear signal. Should QQQQ hold support, a break above the 9-Aug high would be bullish.
***S&P 500 ETF (SPY)***
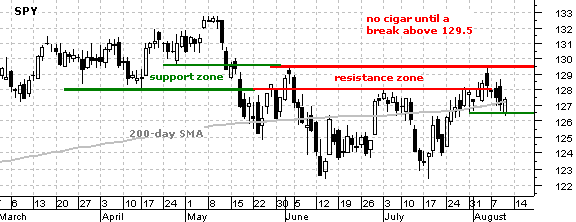
SPY met resistance around 128-129.5 and pulled back over the last few days. This resistance zone is clearly earning its keep and the index needs to break above 129.5 for the bulls to have clear sailing. Right now, I view the May-June decline as a trend changing event and the choppy trading over the last two months is just a big consolidation. With the bigger trend down, I expect a continuation lower and the most recent failure at 129.5 looks like a peak that will not be surpassed anytime soon.
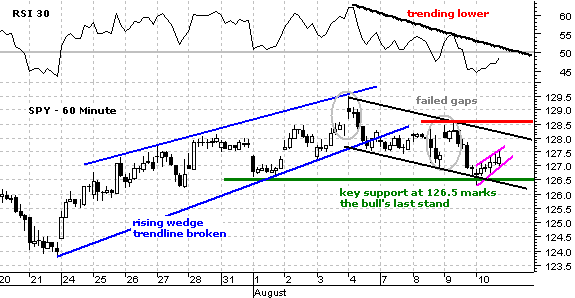
On the 60 minute chart, SPY bounced off support yesterday with a rather tepid rally. The advance looks like a small rising flag that was designed to alleviate a short-term oversold condition. Key support remains at 126.5 and a second break below this level would trigger a bearish signal. The bulk of the evidence is bearish and I expect a support break. RSI is trending lower and below 50. SPY broke rising wedge support and there are two failed gaps in the last five days (gray ovals). My only concern is that the decline over the last five days could be a falling flag (black trendlines). Watch key resistance at 128.6 for a breakout that would turn my bearish prognosis on its head.
***Russell 2000 iShares (IWM)***
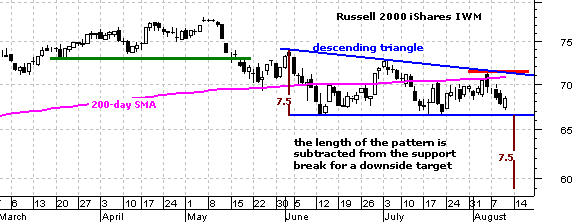
There is no change on the daily chart as IWM consolidates above support at 66.5. The pattern at work is a bearish descending triangle. These are continuation patterns with lower highs and equal lows. A break below the lows (66.5) would signal a continuation lower and target a decline to around 59 (ouch!). Should IWM hold support, look for a break above the early August high to turn bullish.
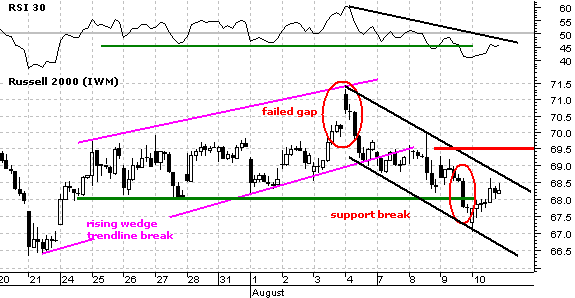
IWM triggered a bearish signal with the break below the rising wedge trendline, failed gap and support break at 68 on Thursday. The stock has been falling since the failed gap last Friday. The decline traced out a falling price channel and the short-term trend is down as long as this channel holds. A break above the upper trendline and key resistance at 69.5 would be bullish. RSI is also trending lower and a break above 50 would turn short-term momentum bullish.
***Sectors***
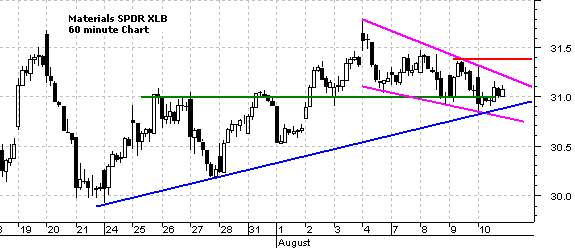
The Materials SPDR (XLB) is at an important juncture. There is support around 31 from broken resistance and the trendline extending up from 24-Jul. The decline over the last five days formed a falling wedge and this could be a bullish consolidation (pullback). A break above 31.4 would signal a continuation higher and be bullish for XLB.
***Industry Groups***
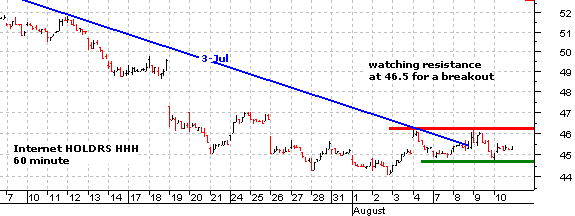
The Internet HOLDRS (HHH) is holding up well over the last five days. A break above the 9-August high would signal a continuation of the early August surge and this would lift the Nasdaq.
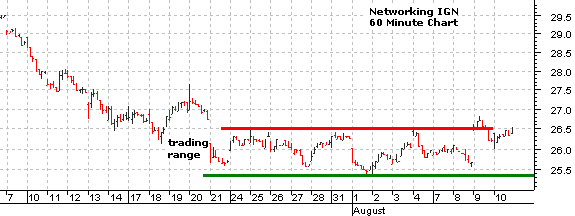
>The Networking iShares (IGN) surged on 9-August and these gains are largely holding. I find the gap and resistance break short-term bullish – provided they hold. Failure and a break below 25.3 would be bearish.
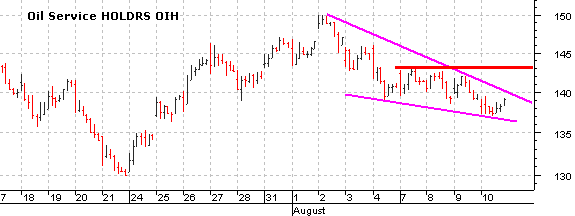
The Oil Service HOLDRS (OIH) formed a falling wedge over the last seven days. This looks like a correction of the prior advance. Watch for a trendline break and move above 143 to signal a continuation higher.
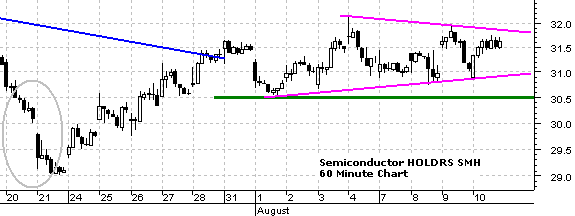
The Semiconductor HOLDRS (SMH) is holding up pretty good and formed a triangle this month. A break above 32 would signal a continuation higher and this would lift the Nasdaq. Failure and a break below 30.5 would be short-term bearish.
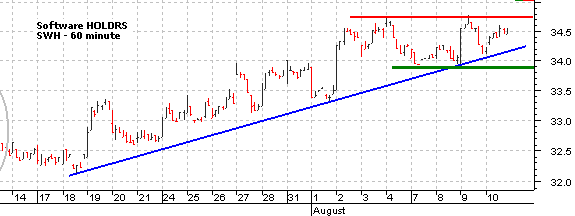
The Software HOLDRS (SWH) is also holding up pretty well with a flat consolidation the last seven days. The short-term trend is up and a break above the early August highs would signal a continuation higher. Failure and a break below 33.8 would be short-term bearish.
***Intermarket***
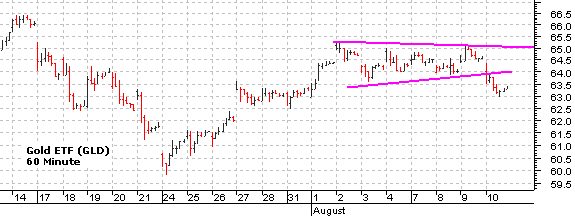
The US Dollar Index bounced above 85 in a flight to safety. This prompted selling in gold and oil also declined. The StreetTracks Gold ETF (GLD) gapped down and broke support at 63.5 with a sharp decline over the last two days. This price action is short-term bearish and I am setting short-term resistance at 65. A recovery and break back above this level would reverse the technical damage done the last few days.
***Breadth***
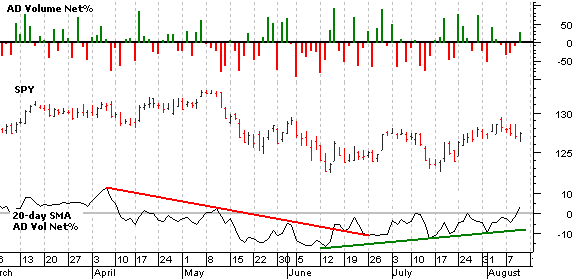
AD Volume Net% finished in positive territory yesterday and breadth is picking up. The 20-day moving average moved into positive territory and to its highest level since early May. The big negative days of early July (20+ days ago) are dropping out of the 20-day moving average and being replaced by positive days. This breakout is positive for breadth.
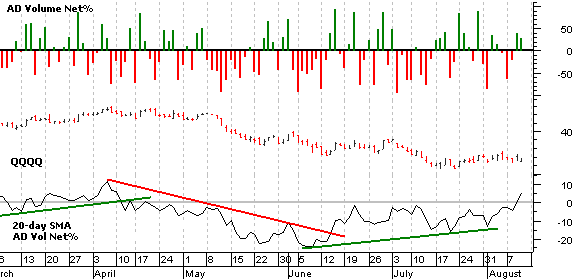
QQQQ breadth is also showing improvement as the 20-day moving average moved into positive territory for the first time since April. There was a lot of selling in May, June and early July. This move into positive territory is bullish for breadth and may lift the Nasdaq.
Good day and good trading
-Arthur Hill
Disclaimer:
Arthur Hill is not a registered investment advisor. The analysis presented is not a solicitation to buy, avoid, sell or sell short any security. Anyone using this analysis does so at his or her own risk. Arthur Hill and TD Trader assume no liability for the use of this analysis. There is no guarantee that the facts are accurate or that the analysis presented will be correct. Past performance does not guarantee future performance. Arthur Hill may have positions in the securities analyzed and these may have been taken before or after the analysis was present.
--------------------------------------------------------
About: The Daily Swing is posted every trading day around 6AM ET and focuses on short-term trends and price patterns. These can be as short as a few days or as long as a few weeks.
--------------------------------------------------------
Sources: Data from Bloomberg.com, CBOT.com, Kitco.com and ino.com; Charting from Metastock (equis.com). Closing data from Reuters.com, eSignal.com, MS QuoteCenter and Yahoo! Finance.
Click here to find out more about Arthur Hills' Daily Swing Trader Report


