"Timer Digest" Tim Ord ranked #5 for one year ending 6/3/05 and #1 in Gold for one year ending 1/13/06.
For 30 to 90 days horizons: Flat for now.
Monitoring purposes XAU: Long XAU, 129.56 on 12/29/05.
Longer Term Trend monitoring purposes: Short SPX On 3/21/06 at 1297.23.
We have "800" phone update that cost $2.00 a min. and billed to a credit card. Call (1-970-224-3981) for sign up. We update Eastern time at 9:45; 3:15 and 4:00. Question? Call me (402) 486-0362.
New Book release called "Master Traders" with Tim Ord on "The Secret Science Of Price and volume. www.HamzeiAnalytics.com/MasterTraders.asp
Workshop “Secrets of Profiting From Price and Volume” Denver, November 4 & 5. Click on www.ord-oracle.com.
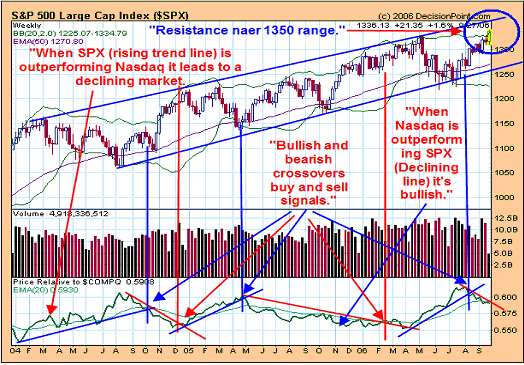
The Weekly SPX market:

Above is the Weekly SPX 500 chart with it “Price Relative to Nasdaq” ratio. When “Price Relative to Nasdaq” ratio is rising, it means the SPX is outperforming the Nasdaq. When this ratio line is falling, it means that the Nasdaq is falling. It is said when the Nasdaq is rising faster then the SPX the market is in an uptrend and bullish. Tops form when the SPX starts to outperform the Nasdaq. On the Chart above, we have labeled where the “Price Relative to Nasdaq” has had bullish and bearish crossovers going back to 2004. When “Price Relative to Nasdaq” crossed down over the “Blue uptrend-Line”, it triggered a bullish signal. When “Price Relative to Nasdaq” crossed up over the “Red down trend-line” it triggered a bearish signal. Right now the Nasdaq is out performing the SPX and the trend is down on “Price Relative to Nasdaq” and below the red downtrend line in a bullish mode for now. When the red downtrend line is crossed over to the upside, it will trigger a bullish sign. Also notice the “Blue Channel Line” we have drawn on the chart above dating back to 2004. So far the market has remained in this channel and the uptrend is intact. Resistance lies near the 1350 on the top channel line which is also the SPX “Double Head and Shoulders Bottom” projection we have pointed out in the past. We sold our long SPX position at 1311 area and waiting for the next signal. We are staying flat for now.

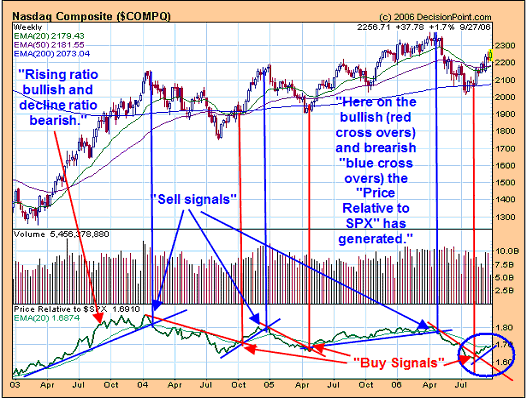
Weekly Nasdaq market:
Here is the inverse of the ratio we studied for the SPX where we are now comparing Nasdaq to the SPX. Going back to 2003 “Price Relative to SPX” has done a good job of picking highs and slows for the Nasdaq market. Notice to the far right of the chart above that the Ratio is rising and implies the Nasdaq is out performing the SPX and in a bullish mode for the markets. We sold out our long position on the Nasdaq at 2194. Volume over the last three days has been good and shows there is still energy to push higher. “Rydex Cumulative Net Cash flow” is still in bullish area and bullish for the markets. The “Four Year Cycle” low is due in October of this year but may show up late. We prefer the sidelines for now.
Bought Ivan (Invanhoe Energy) 4/13/06 at 2.55,Energy stock. Could go to Gap area (November 2003) near 5.40. On 4/2, we Bought ASTM at 1.92, Biotech group. Bought GNBT at 1.74 on 7/10/06, biotech. Bought ARIA at 3.89 on 7/27/06, Pharmaceutical.

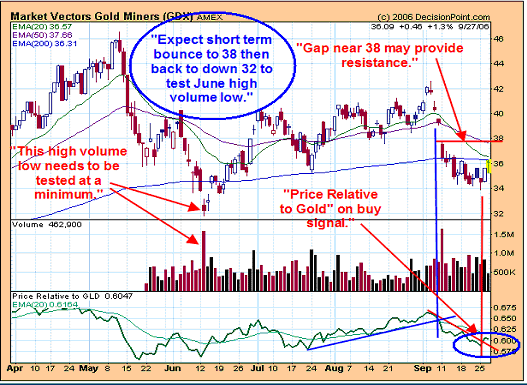
We are expecting a bounce to the 38 range on the “Gold Miners” index. “Price Relative to Gold” has had a bullish crossover and currently on a short term buy signal. Resistance lies near the gap level at 38. If the 38 Gap level is tested on lighter volume then that will be a bearish signal and suggest the market will turn back down. Support lies at the June low near the 32 level. If the market tests the 38 gap level on lighter volume it will have a downside target to the 32 level. If the 32 level is tested on lighter volume then a bullish signal on the bigger time frames could be triggered there. Since 2000 bottom in the XAU, all major impulse waves began when the XAU had a “Price Relative to Gold” ratio that hit below .20. Therefore, when and if the 32 range is tested on the “Gold Miners” index and .20 range or lower is hit for the XAU “Price Relative to Gold” ratio then that will imply the next major impulse wave to the upside will begin.
"Timer Digest" has ranked Tim Ord as the #1 gold timer for one year ending 1/13/06.
We bought PMU (5/27/05) at .50 and bring our average price to .81.
Long TRE at 2.55 on 11/1/05, sold at 3.39 on 12/3/05 for 33% gain.
Long NG at 8.47 on 11/2/05. Sold NG on 11/30 at 9.20 for gain of 9%.
Long DROOY at 1.27 on 11/9/05, Sold 1/19/06 at 1.89 for 49% gain.
Long AGT at .33 on 2/1/06, Sold at .66 on 4/21/06 for 100% gain.
Long TRE at 6.84 on 3/6/06, sold 9/13 at 5.19 for loss 24%
We bought TGB at 1.84 on 3/27, Sold on 8/10 at 2.34 for 27% gain.
GRZ, bought at 6.30 on 5/19/06, sold 9/13 at 4.30 for loss of 32%.
We doubled our positions in BGO on (7/30/04) at 2.34 and we now have an average price at 2.70.
Long NXG average of 2.26.
We bought PMU (5/27/05) at .50 and bring our average price to .81.
Bought RNO on 9/11/06 at 2.15. Sold 9/12 at 2.18 for 2.3% gain.
For examples in how "Ord-Volume" works, visit www.ord-oracle.com.


