***Position Summary***
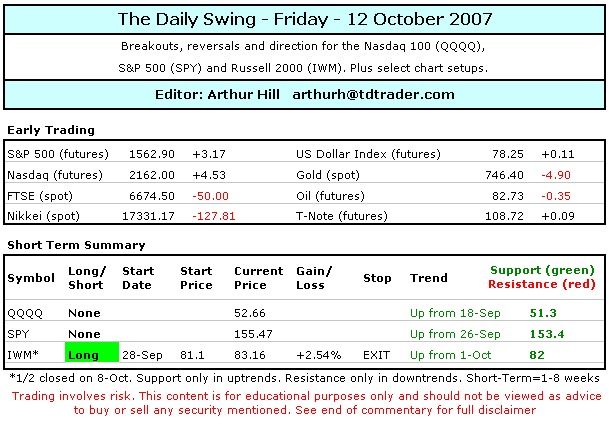
Stocks recovered and firmed after a sharp drop yesterday afternoon and this shows strength. The gains from last week are holding and the medium-term trends remain up. Even though SPY, DIA and QQQQ are at or near overbought levels, the uptrends still pull trump and I have yet to see any signs of weakness. Yesterday’s small decline was more about indecision and consolidation than selling pressure. With the medium-term and short-term trends up, there are still only two options for traders: out or long. Risk for new longs in QQQQ, SPY and IWM is well defined if traders set their stops just below yesterday’s lows. However, overbought conditions increase the odds of choppy trading and the chances of a whipsaw. The chances of a pullback are too high and I will remain on the sidelines.
***Previous Day***
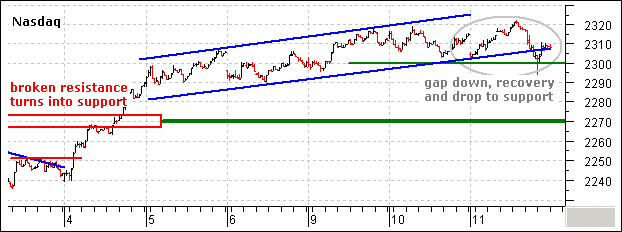
It was strange price action yesterday as stocks opened weak, worked their way higher after the open and then dropped sharply in the afternoon. The Fed minutes and a NYC plane crash were to blame for the afternoon sell off. The Fed expects an economic slowdown in the second half and remains concerned about inflation. The NYC plane crash spooked the market, but stocks firmed after reports confirmed it was not a terrorist act. Nonetheless, all of the major indices finished with small losses on the day. Six of the nine sectors were lower with Utilities, Consumer Staples and Industrials edging higher. The Energy and Materials sectors led the way lower. These two sectors seem to lead higher one day and then lead lower the next. A major battle is raging between bulls and bears as XLE and XLB trade near support. In the inter-market arena, the US Dollar Index gapped up and closed sharply higher. This follows the breakout I reported on Monday. Gold was little changed and the StreetTracks Gold ETF (GLD) remains near support at 55. Strength in the US Dollar Index is weighing on gold. The U.S. Oil Fund ETF (USO) moved lower and remains weak. The iShares ~20-year T-Bond Fund (TLT) closed lower and remains in corrective mode as it enters a support zone around 86.5-89.
***Nasdaq 100 ETF (QQQQ)***
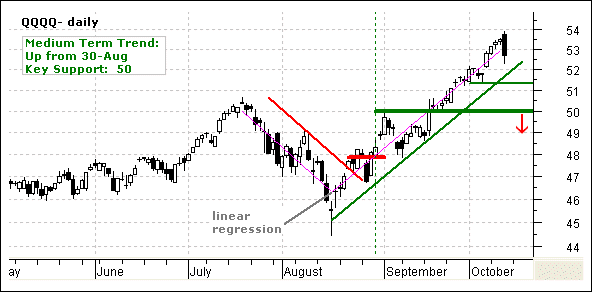
The song remains the same as QQQQ consolidated for the fifth straight day. QQQQ surged above 41 last week and then formed five small candlesticks. These show indecision, but there are no signs of weakness or selling pressure because the gains are holding. Even though buying pressure may seem weaker, it is still stronger than selling pressure. I remain focused on what it will take to reverse the current uptrend. Until this trend actually reverses and material signs of selling pressure emerge, the base-case scenario is for a move to the May high at 43. Right now, QQQQ is holding the August trendline and RSI remains comfortably above 50. A downtrend is impossible as long as both of these levels hold. Key support at 39.5 is based on the consolidation lows from late September.
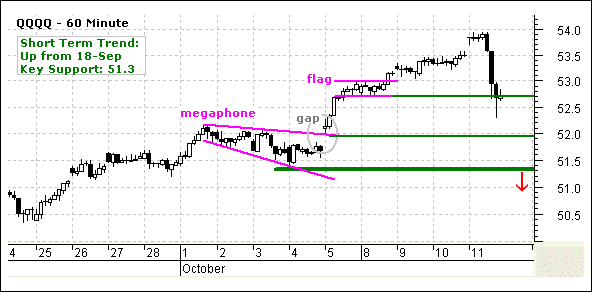
QQQQ took a hit in the afternoon, but held consolidation support to keep the uptrend alive. A break below the lows of the last five days (41.17) would be a minor negative, but this would not be enough to turn bearish. At most, I would expect a pullback into the support zone around 40.5-41. The breakout at 41 is holding and the prior resistance zone turns into support zone (40.5-41). I will consider a long position on a move into this support zone. The alternative is to nibble at current levels with a stop-loss on a move below 41.17. When I say nibble, I mean a small position or 1/3-1/2 of a normal position. QQQQ is trading near overbought levels on the daily chart and this makes it vulnerable to sharp setbacks. No sense getting greedy at current levels.
***S&P 500 ETF (SPY)***
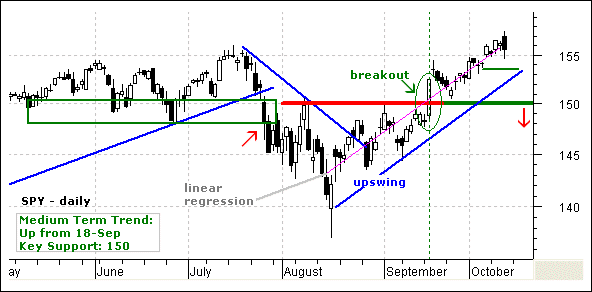
There is no real change in SPY. The ETF stalled over the last five days with five small candlesticks around 135. This shows some indecision, but this is no different than the indecision seen in August and September (gray ovals). Surges are often followed by periods of indecision and this is just a consolidation or rest before the next move higher. Because the current trend is clearly up, the odds favor a move higher and not a reversal lower, even if RSI is overbought. This overbought condition just tells me a move higher will likely be a choppy affair and that the easy gains are over. SPY has support around 131-133 and the bulls are in firm control as long as 131 holds.
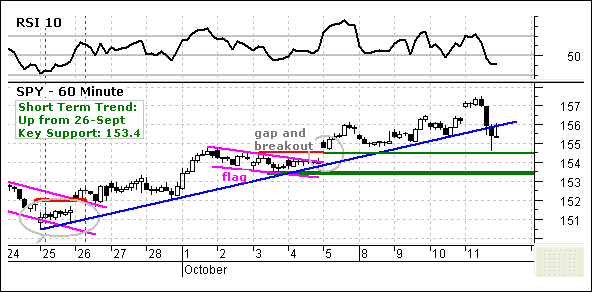
As noted above, SPY is trading in its third consolidation since mid September (magenta trendlines). On the prior two consolidations, SPY broke support and then quickly reversed (gray ovals). This is testament to the strength of the current uptrend. SPY pierced support yesterday, but managed to firm and hold the support by the close. This is positive price action and shows more resilience. The fake support break may have already occurred and a move above 135.5 would open the door to 137.5.
***Russell 2000 iShares (IWM)***
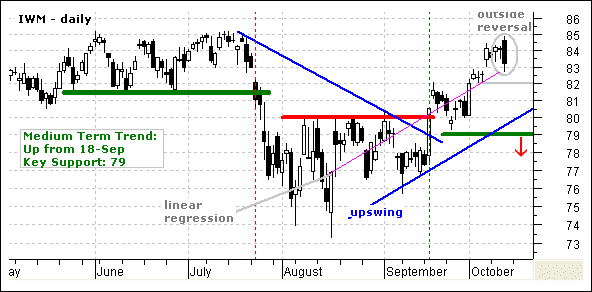
There is no real change in the IWM analysis either. The ETF broke resistance with a surge above 73 last week and consolidated with three doji over the last four days. The breakout is holding and the bulls have a clear edge. First, the lower trendline extending up from the July lows shows a clear uptrend. Second, IWM is forging ahead with higher highs and higher lows. Third, RSI remains above 50 and momentum is bullish. This is an uptrend by definition and I expect a challenge to the May highs as long as key support at 69.5 holds.
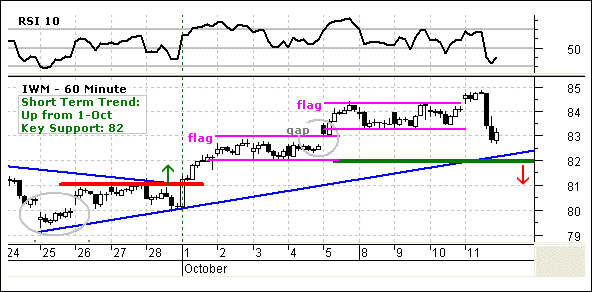
It looks more and more like IWM will hold broken resistance and continue higher. The breakout 73 is now four days old and IWM consolidated above 73. This is the first support level to watch for signs of trouble. While a break below 73 would be negative, I would not turn bearish at the first sign of weakness. More likely, I would expect some firming within the prior consolidation (71-73). As long as 73 holds, the odds favor a continuation of the early October surge and medium-term uptrend.
***Chart Highlights***
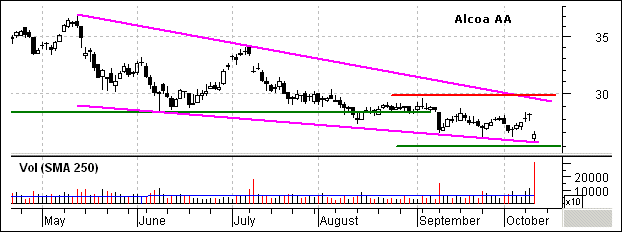
This is just a reminder that earnings season is here and traders should check for reporting dates before entering trades. For those that trade heavily, the positive and negative surprises are likely to even out in the long run. However, do not be surprised with a negative surprise, as was the case with Alcoa (AA) yesterday. Traders should also pay attention to price action after the open and after the initial response to earnings. In the case of Alcoa, the stock managed to close above its open and is holding support around 26-27. A recovery from here and move above 28.5 would be bullish. Failure to recover the gap and a move below 26 would suggest that this stock is dead money (at best).
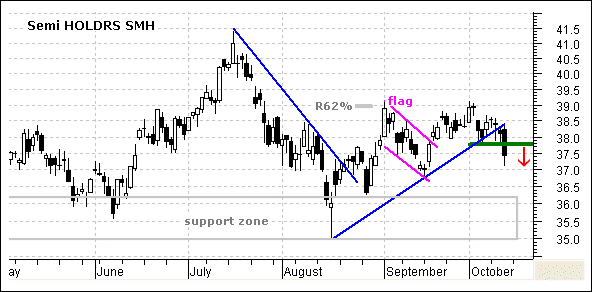
The Semiconductor HOLDRS (SMH) is perking up and looks poised to break consolidation resistance. The stock led the way higher from mid July to early September and then formed a triangle consolidation. This represents a rest in the uptrend and a break above 35 would signal a continuation higher. Notice that the 200-day moving average also marks resistance around 35 and upside volume has been above average twice this month. The upside target on a breakout is around 39 and key support resides at 33. Needless to say, a breakout in SMH would stoke the Nasdaq.
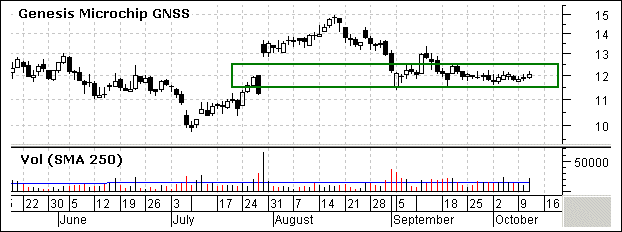
I am keeping my eye on Genesis Microchip for a potential pop and breakout. The stock surged in Jul-Aug, pulled back to around 12 and firmed over the last few weeks. Trading slowed to a crawl recently as the stock consolidated between 11.5 and 12.5. I am watching 12.5 for a breakout that would signal a continuation of the Jul-Aug advance. This is a tricky play because earnings are scheduled for 24-Oct and this report will likely move the stock.
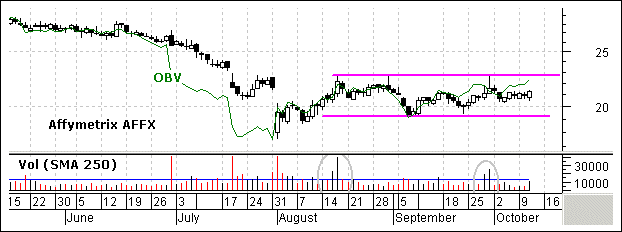
Affymetrix (AFFX) is a biotech equipment stock. They sell picks and shovels to the companies developing drugs. The stock declined from 60 in Jul-05 to below 20 in early August. The move below 20 formed with a gap down and long white candlestick. Interestingly, the stock firmed and filled the gap with a move to 23 in August. AFFX has since traded flat with support at 19 and resistance at 23. I am seeing some signs of accumulation in this trading range as OBV broke above its August high and upside volume spiked higher a few times since mid August.
***Breadth***
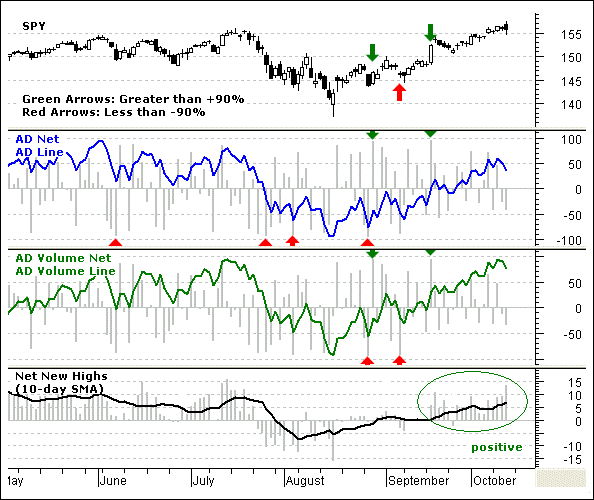
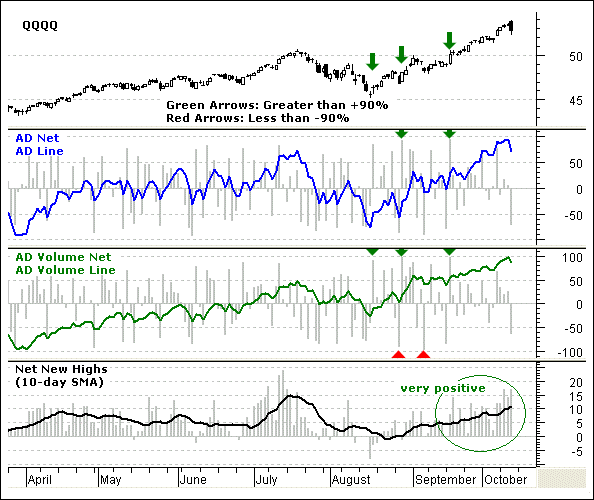
AD Volume Net% for SPY and QQQQ has traded pretty flat the last 4-5 days and we could be getting close to a pop. The 10-day moving averages have also corrected back to the zero line and this is the make-or-break point. A sharp down day would turn short-term breadth bearish, but a strong up day would keep the 10-day moving average in positive territory and breadth bullish.
Good day and good trading -Arthur Hill
---------------------------------------------------------------
Click here to post a comment, suggestion or question.
---------------------------------------------------------------
Disclaimer: Arthur Hill is not a registered investment advisor. The analysis presented is not a solicitation to buy, avoid, sell or sell short any security. Anyone using this analysis does so at his or her own risk. Arthur Hill and TD Trader assume no liability for the use of this analysis. There is no guarantee that the facts are accurate or that the analysis presented will be correct. Past performance does not guarantee future performance. Arthur Hill may have positions in the securities analyzed and these may have been taken before or after the analysis was present.
--------------------------------------------------------
about: The Daily Swing is posted every trading day around 6AM ET and focuses on short-term trends and price patterns. These can be as short as a few days or as long as a few weeks.
--------------------------------------------------------
Sources: Data from Bloomberg.com, CBOT.com, Kitco.com and ino.com; Charting from Metastock (equis.com). Closing data from Reuters.com, eSignal.com, MS QuoteCenter and Yahoo! Finance.


