***Thanksgiving Schedule***
Trading is going to be fairly light most of next week and Iam going to take the opportunity for a break. The Daily Swing will becondensed on Monday and Tuesday (only QQQQ, SPY and IWM). I will be taking off Wednesday,Thursday and Friday. The Daily Swing will not be published on these days.Happy Turkey Day!
***Position Summary***
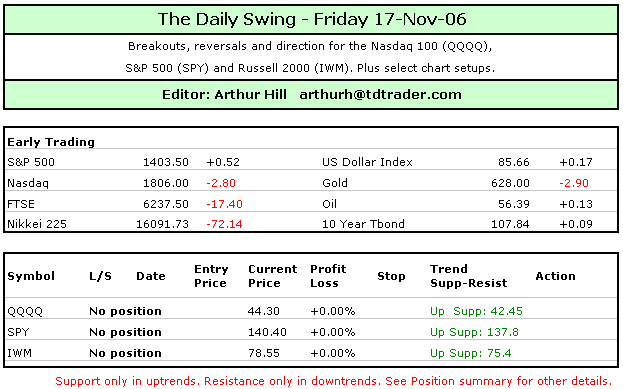
Pesky divergences and overbought conditions remain in QQQQ,SPY and IWM. RSI is near overbought levels on the weekly charts. There are negativedivergences on the daily charts and RSI hit overbought levels on the 60 minute charts.Despite these warning signs, the long-term, medium-term and short-term trends are all up.We have yet to even see a short-term breakdown and turning bearish now is premature. It isa top picking exercise at best and a tape fighting exercise at worst. Why fight obviousstrength. Holding longs with profits is ok. Buying at current levels does not offer a goodrisk-reward ratio. Short positions are out of the question. The advance from Jul-Aug hadlots of power and it is unlikely to reverse on a dime. More likely, buying pressure willslowly fade and I would expect a choppy trading range to form. We need some sort ofdistribution pattern to evolve before considering a medium-term top. As far as theshort-term trend is concerned, I will be watching support from the 8-9 November lows.Pullbacks are just minor corrections as long as these lows hold.
***Previous Day***
It was a mixed day on Wall Street. The Nasdaq and S&P500 were up, while the Russell 2000 and NYSE Composite were down. Techs and large-caps ledthe way higher yesterday. Small-caps lagged for the day.
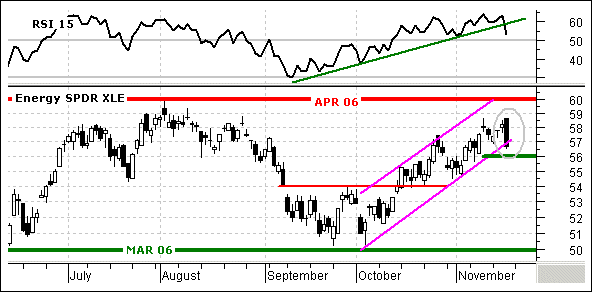
Seven of the nine sectors were up with Consumer Staples andFinance leading the way higher. The Energy and Materials sectors were down. The EnergySPDR (XLE) got hammered with a –2.75%. We have the beginnings of a breakdown in XLEas RSI broke the September trendline and the ETF formed a big bearish engulfing. Thisfollows last week’s gap up and doji around 58. The bearish engulfing filled the gapand I would treat this as an exhaustion gap near resistance. Further weakness below 56would confirm the bearish engulfing and a move towards support at 50 would be expected.
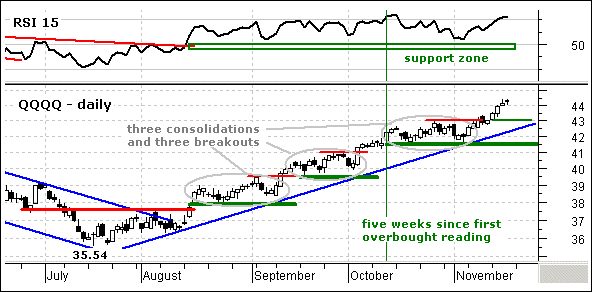
No change: RSI moved above 70 for the first time since midOctober and this testifies to the power behind the current advance. Looking back at thelast two consolidations and breakouts, I noticed that broken resistance turned intosupport and the resistance breakouts held (39.5 and 41). Broken resistance at 43 turnsinto support and this is the first level to watch for signs of weakness. Key supportremains at 41.5 and it would take a move below this level to reverse the medium-termuptrend.
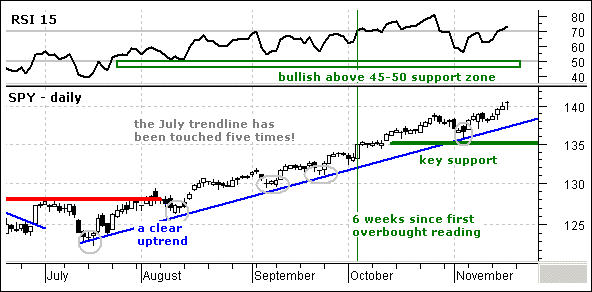
No change. RSI for SPY also moved back above 70 yesterdayand this testifies to the power behind the latest advance. Weak advances do not becomeoverbought. RSI first became overbought six weeks ago and momentum should be consideredbullish as long as the 45-50 support zone holds. On the price chart, key support remainsat 135 and this defines the medium-term uptrend.
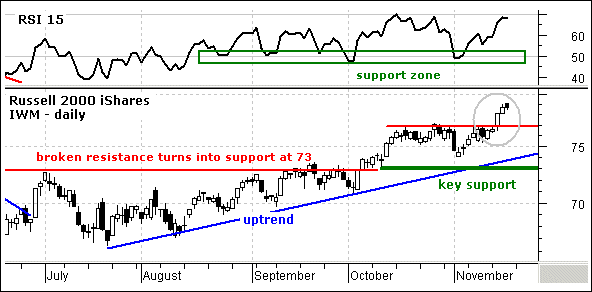
There is no change on this chart as IWM extends itsbreakout. The Russell 2000 iShares (IWM) finally broke resistance at 77 and this affirmsthe current uptrend. As with SPY and QQQQ, RSI held the 45-50 support zone and momentumremains bullish. The ETF held the breakout at 73 and a new reaction high is none otherthan bullish. I will leave key support at 73 and it would take a move below this level toreverse the current uptrend.
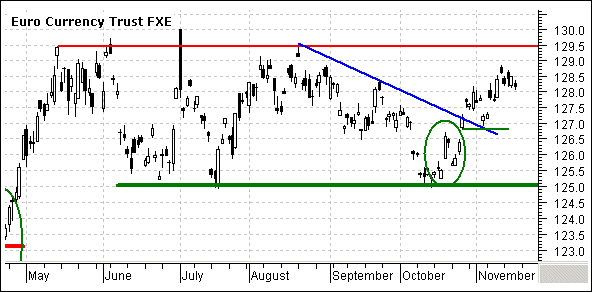
The US Dollar Index is firming at support (85) and the EuroCurrency Trust (FXE) is trading just below resistance at 129.5. The gap off support andbreakout in late October are bullish. However, the ETF has been range bound since mid Mayand there is a ton of resistance around 129.5. A breakout here would be big-time bullish.Look for a move below 126.7 to negate the October breakout and give the bears the edge.
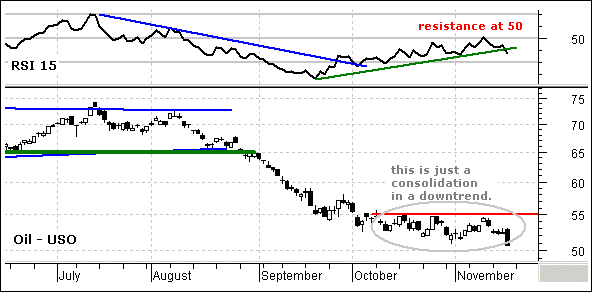
Don’t look now, but the U.S. Oil Fund ETF (USO) isresuming its downtrend, which was never in question. The consolidation over the last fewweeks was viewed as a rest in the downtrend and the ETF never broke 55. RSI met resistanceat 50, just as it should in a downtrend, and broke the September trendline yesterday. Allsigns point to further weakness and this is the reason I am wary of the Energy sector.Sure, Energy related companies can make lots of money at $51 oil, but not as much asbefore and the trend is down.
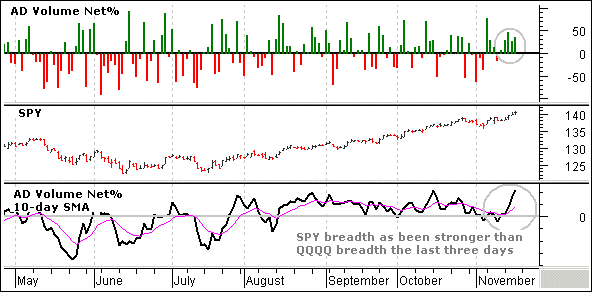
AD Volume Net% for SPY and QQQQ finished positive for thefourth day in a row. Both 10-day moving averages are in positive territory and trading atrelatively high levels. Even though the daily readings have not been that strong the lastsix days, overall breadth is clearly bullish and there are no signs of absolute weakness.
Good day and good trading -Arthur Hill
---------------------------------------------------------------
Click here to posta comment, suggestion or question.
---------------------------------------------------------------
Disclaimer: Arthur Hill is not a registered investment advisor. The analysis presented isnot a solicitation to buy, avoid, sell or sell short any security. Anyone using thisanalysis does so at his or her own risk. Arthur Hill and TD Trader assume no liability forthe use of this analysis. There is no guarantee that the facts are accurate or that theanalysis presented will be correct. Past performance does not guarantee futureperformance. Arthur Hill may have positions in the securities analyzed and these may havebeen taken before or after the analysis was present.
--------------------------------------------------------
about: The Daily Swing is posted every trading day around 6AM ET and focuses on short-termtrends and price patterns. These can be as short as a few days or as long as a few weeks.
--------------------------------------------------------
Sources: Data from Bloomberg.com, CBOT.com, Kitco.com and ino.com; Charting from Metastock(equis.com). Closing data from Reuters.com, eSignal.com, MS QuoteCenter and Yahoo!Finance.


