YEE HAW it's scorch time! Futures up. World up.
#11

Posted 06 March 2007 - 01:32 AM
#12

Posted 06 March 2007 - 08:29 AM
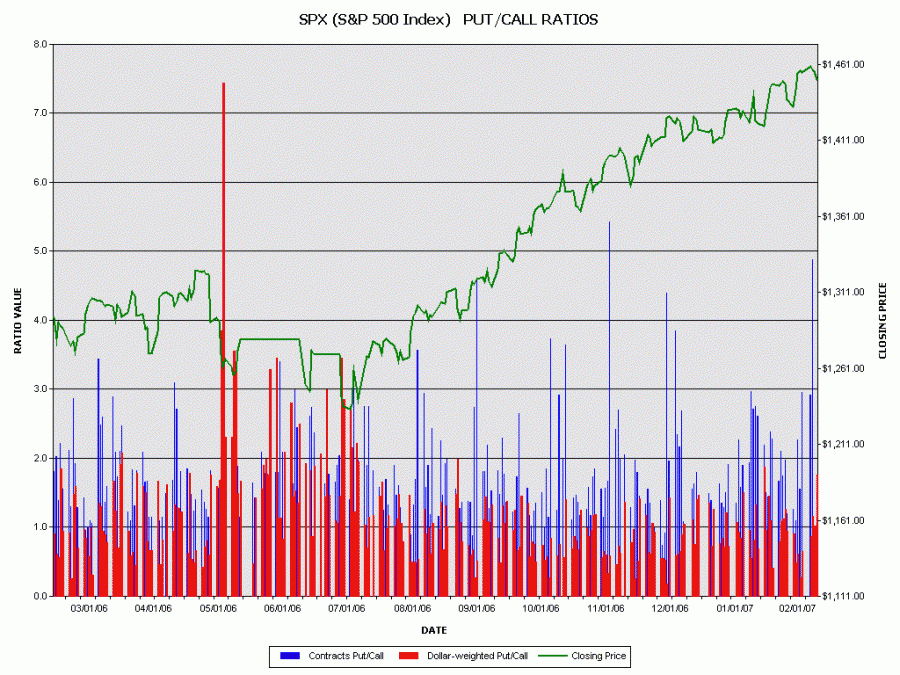
I'm pretty sure this is some sort of large scale "forced" liquidation. It was telegraphed, too, if you remember that SPX P/C chart I posted. While I agree that we probably have more coming, the one caveat is that the selling may not be as serious as it looks. If it is forced selling, then when the are out, the pressure will come off.

I want to make very sure that I'm not caught all beared up if we get a huge reversal. For now, however, there sure looks to be a liquidity crunch and I think I'd focus new shorts (on a rally) in the smaller cap issues. Look at the underperformance by the RUT and MID.X.
Mark
Assuming this whole thing is a normal correction within the bull market which I dont think it is, but if it is, then the logical place to get a ST bounce will be around SPX 1360... In other words, SPX should keep making relatively small lower lows while McO diverges for a few days.
Normally , the first multiday rally off this low should be choppy, shallow and corrective like a bear flag. After that we should get another leg down, probably lower lows because internals and volume printed power spikes in the first leg. This whole thing in my opinion doesnt look normal, this is different than others, something quite unholy. This one butchered the leadership and it is so powerful as evident from intense volume and internals that developed in very short time frame relative to the past instances.
Mark S Young
Wall Street Sentiment
Get a free trial here:
http://wallstreetsen...t.com/trial.htm
You can now follow me on twitter
#13

Posted 06 March 2007 - 09:10 AM
However I wonder why the market didn't react intraday that day. I guess it took a while to sink in managing heads.
What is more interesting to me is that, Nasdaq printed a perfectly natural breakaway gap that day. This rarely occurs in an artificial move. Also I wonder why all the leadership sectors like REITs got massacred big time. I noticed that interest rate sensitive sectors and indices got the biggest hit.

D&Co.,
I'm pretty sure this is some sort of large scale "forced" liquidation. It was telegraphed, too, if you remember that SPX P/C chart I posted. While I agree that we probably have more coming, the one caveat is that the selling may not be as serious as it looks. If it is forced selling, then when the are out, the pressure will come off.
Edited by xD&Cox, 06 March 2007 - 09:12 AM.
#14

Posted 06 March 2007 - 09:46 AM
Nice chart RD. Because I only lost 23k, not1.5m, I have time on my hands. Thought I would add some lines to your chart so you could complain about it.Looking at NAMO extremes and previous price congestion, it looks like a logical place to pause in here. (Again look at May's action)
However the gapping of the NASI dots makes it look like it's just going to fall off a cliff. Continue falling that is.
http://stockcharts.com/c-sc/sc?s=$NDX&p=D&yr=3&mn=0&dy=0&i=p88977852238&a=91503932&r=2795.png

A DOG ALWAYS OFFERS UNCONDITIONAL LOVE. CATS HAVE TO THINK ABOUT IT!!
#15

Posted 06 March 2007 - 10:11 AM
#16

Posted 06 March 2007 - 11:01 AM
Hi mss,
yes a ST bounce should be expected normally as suggested by your chart but was this a normal move.
I have a feeling we will print marginal lows before this expected ST bounce
Well 1373.97 is close enough for me. I am really only looking for a "dead cat bounce" and that can be a one or two day wonder. Unless a lot of things change, 1300-1325 is in play until I see some signs of money coming back, in truck loads.

What a week, but we were warned that things were getting weaker. Warning did not say, "look out below" it did imply a loss of money flow at a faster rate. This weeks close broke the "0" line strongly suggesting much more to come. We should expect a "dead cat bounce" within one to three days.
SPX can touch 1370 real quick and 1300-1325 range is also possible.
Keep in mind all my comments are based on me NOT BEING a day trader, (most of the time).
Best to you and your sharing your work.
mss
A DOG ALWAYS OFFERS UNCONDITIONAL LOVE. CATS HAVE TO THINK ABOUT IT!!


