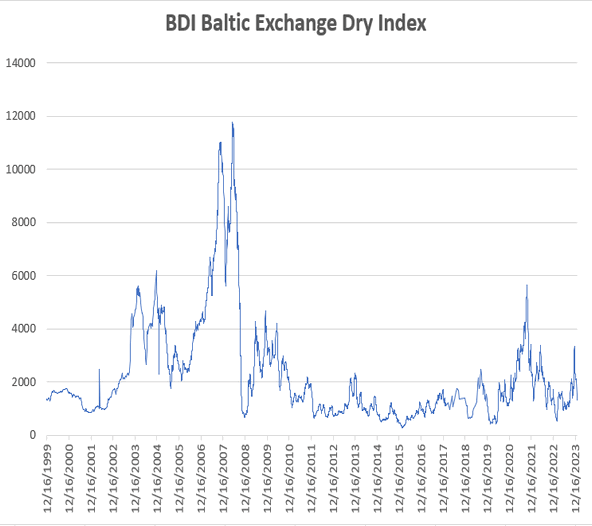
There is ecomonic data
#2

Posted 06 March 2007 - 10:34 AM
#3

Posted 06 March 2007 - 10:39 AM
thanks
If possible ..could you post it here in this thread..or a new one.
http://www.traders-t...showtopic=67218
#4

Posted 06 March 2007 - 10:54 AM
#5

Posted 06 March 2007 - 10:59 AM
i missed that.......ill see if i can find a new oneCheif ...did you see this request?...possible?
thanks
If possible ..could you post it here in this thread..or a new one.
http://www.traders-t...showtopic=67218
Cheif, this is 2004 all over, imho. This time the uncertainty that will resolve will be the short term Fed rates (down) at the second half of the year instead of an election.
BTW, BDI is a lagging indicator, imho. The two largest corrections in 2004 and 2005 started when the BDI was at the top of their ranges...
- kisa
non of that is part of the stock market equation...of that i am certain
#6

Posted 06 March 2007 - 11:21 AM
If you notice the BDI in 2000, the world stock index had gone down quite a bit but BDI was still going up, showing that the stock markets were the leading indicator for that slump in the economy.
Article Link:Freight Indices Steam Toward Recovery:
http://www.thestreet...c/10059743.html
Article Link: The Best Economic Indicator you've never heard of - http://www.slate.com/id/2090303/


Edited by Russ, 06 March 2007 - 11:30 AM.
"In order to master the markets, you must first master yourself" ... JP Morgan
"Most people lose money because they cannot admit they are wrong"... Martin Armstrong
http://marketvisions.blogspot.com/
#7

Posted 06 March 2007 - 11:22 AM
#8

Posted 06 March 2007 - 11:32 AM
non of that is part of the stock market equation...of that i am certain
Which one the rates or the BDI? I thought you are trying to imply something about the BDI. For the rates, I don't know how you measure the liquidity, but the operators have control over the market about 30-35% of the time, just enough to position themselves usually, the remaining 65% of the stock market IT moves come from the liquidity or the bond market.
The liquidity was drying prior to the top, you always ignored, but look at what was happening to the mortgage sector and the commercial credit growth to get a clue. Too bad, you don't want to learn anything new, you just want to teach, yet we learned from you. I made a killing when you were showing the sky and bashing my ideas just the same, btw. Therefore I suspect there is more downside...
- kisa
#9

Posted 06 March 2007 - 11:34 AM
"In order to master the markets, you must first master yourself" ... JP Morgan
"Most people lose money because they cannot admit they are wrong"... Martin Armstrong
http://marketvisions.blogspot.com/
#10

Posted 06 March 2007 - 11:58 AM
i implied nothing when it comes to the relationship between the bdi and the stock market........what it did point out tho was that those looking at an economic slowdown was at odds with what the bdi was pointing to.......the fact is however that if you put the bdi chart up against the weekly ad line of the primary market......you will see that they were indeed in synch.....with what most stocks were doing from march 2000.......as you will recall the weekly ad line started its meltup from its march 2000 lownon of that is part of the stock market equation...of that i am certain
Which one the rates or the BDI? I thought you are trying to imply something about the BDI. For the rates, I don't know how you measure the liquidity, but the operators have control over the market about 30-35% of the time, just enough to position themselves usually, the remaining 65% of the stock market IT moves come from the liquidity or the bond market.
The liquidity was drying prior to the top, you always ignored, but look at what was happening to the mortgage sector and the commercial credit growth to get a clue. Too bad, you don't want to learn anything new, you just want to teach, yet we learned from you. I made a killing when you were showing the sky and bashing my ideas just the same, btw. Therefore I suspect there is more downside...
- kisa


