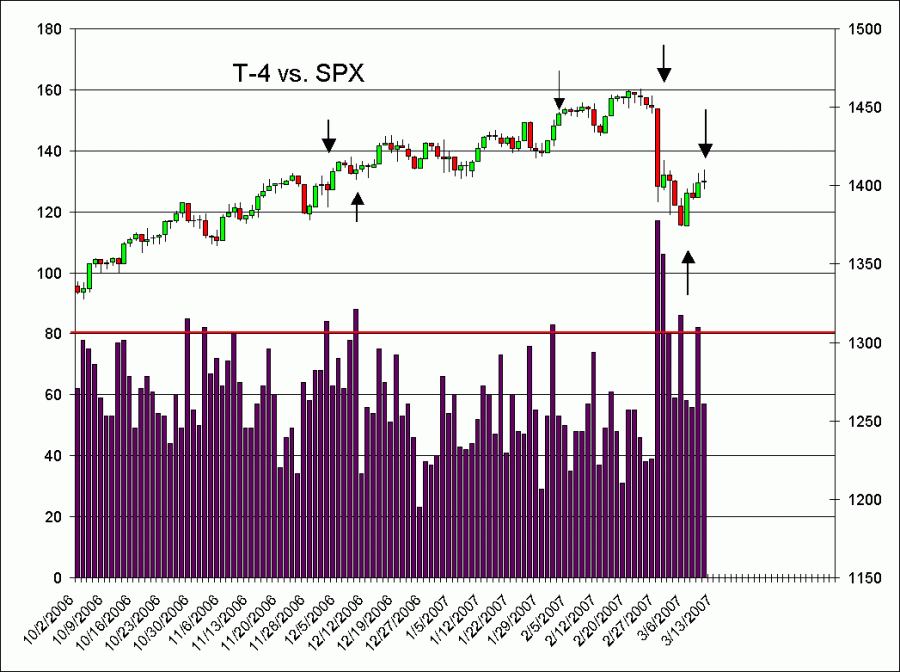

Current T-4 Chart
Started by
OEXCHAOS
, Mar 10 2007 05:49 PM
2 replies to this topic
#1

Posted 10 March 2007 - 05:49 PM
Mark S Young
Wall Street Sentiment
Get a free trial here:
http://wallstreetsen...t.com/trial.htm
You can now follow me on twitter
#2

Posted 10 March 2007 - 06:46 PM
Mark: When you posted the "prototype chart" and asked for comments, several made comments etc. Is there anyway we can have an explanation of the methodology eg weightings etc.? TIA...MDW
Lead, Follow or Get Out of the Way...
Be Sure to Perform Your Own Due Diligence
Be Sure to Perform Your Own Due Diligence
#3

Posted 10 March 2007 - 06:53 PM
MDW,
First of all, thanks for your support of our site. Secondly, the T-4 is merely a measure of activity on TT. Activity here, unless artificially goosed, indicates that folks feel compelled to comment. That seems to be correlated with turns, but higher and lower. I don't weight anything, nor do I goose the data. I just take it as it comes from the entire site.
Mark
Were you referring to the T-4 or the Bull/Bear ratio?
Mark
Mark S Young
Wall Street Sentiment
Get a free trial here:
http://wallstreetsen...t.com/trial.htm
You can now follow me on twitter


