***Position Summary***
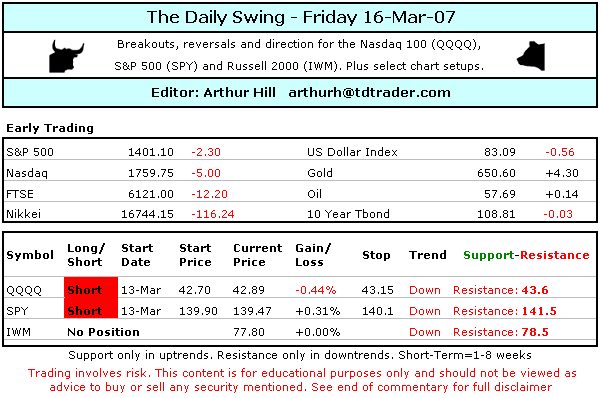
Thursday looked like the calm before the storm. A bullishstorm or a bearish storm? Tuesday’s gaps and sharp declines set the bearish tone, butthis was thrown off by Wednesday’s strong recovery. Small-caps and techs led thisrecovery, while Finance and Consumer Discretionary lagged. It is a pretty split market andthis could lead to directionless trading for the broad indices. The bears charged onTuesday, the bulls answered on Wednesday and there was gridlock on Thursday. Small flagsformed in many indices and stocks on the intraday charts and I will be watching the flagboundaries for the next signal. There are a couple of potential problems though. First,CPI will be reported this morning and this could move the market early. Second, it isquadruple witching day and this could increase volatility. These things are sometimesnon-events and sometimes they produce wild swings. It is hard to tell and traders need tobe on their toes. I have set my levels in the commentary below, but a little volatilitycould result in whipsaws and small positions are recommended.
***Technical Highlights***
~Low Volume Bounce ~ Stocks extended their reboundyesterday and all of the major indices finished in the green. The Russell 2000 led the way(+1.02%) and the Nasdaq 100 lagged (+.10%). Volume was below average on this rally andthat is not a good sign for the bulls. Stocks engineered a sharp recovery with big volumeon Wednesday and Thursday’s low volume follow through does not show much confidence.Except for the Russell 2000, yesterday’s gains were also quite small and this alsoshow hesitancy.
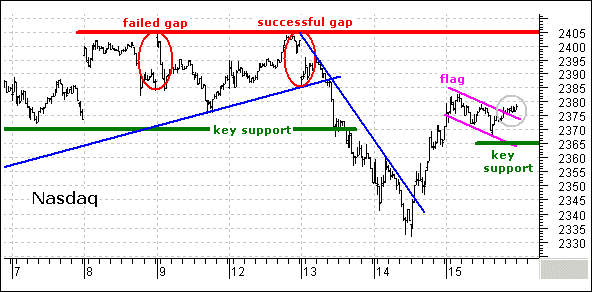
~Remember the Gaps!~ Eight of the nine sectorsended the day positive. The Energy SPDR (XLE), which led the sectors on Wednesday, was theonly loser with a .02% loss. The Materials, Industrials and Utilities sectors were thestrongest. As far as the S&P 500 is concerned, my eyes are on the ConsumerDiscretionary SPDR (XLY) and Finance SPDR (XLF). Consumer Discretionary represents retailspending and the most economically sensitive companies. Finance represents banks, brokersand the monetary health of the economy. Both ETFs gapped down on Tuesday, rebounded onWednesday and formed flags on Thursday. They both remain below Tuesdays gaps and these twokey sectors show relative weakness. This is not a good sign for the S&P 500 or thebroader market. A break above yesterday’s highs would be short-term bullish for XLFand XLY, while a break below yesterday’s lows would negate the flags and call forfurther weakness.
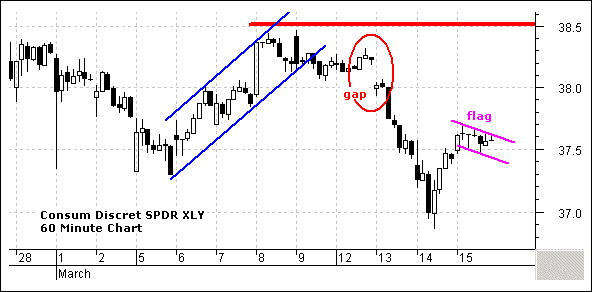
~Gold Stocks Surge~ Led by NEM and FCX, the GoldMiners ETF (GDX) surged off support yesterday. The ETF established a support zone around36-37 with bounces in November, January and March. A big doji formed on 5-Mar and the ETFgapped up the next day. There was another support test with a small hammer on Tuesday andthe ETF gapped up yesterday. This is positive price action and a break above 39 would bebullish. On the StreetTracks Gold ETF (GLD) chart, the ETF surged to trendline resistanceand then pulled back. Look for a move above 64.5 to break the fall and start a newupswing.
 ***Nasdaq100 ETF (QQQQ)***
  gifs/d0316_qqqq_i.gif
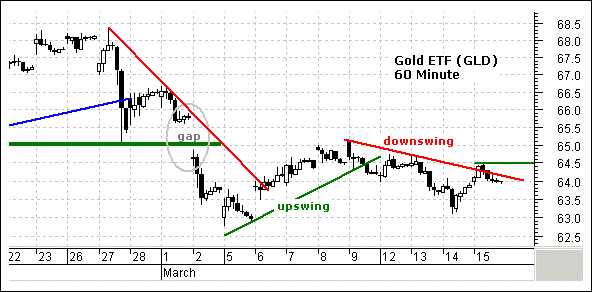
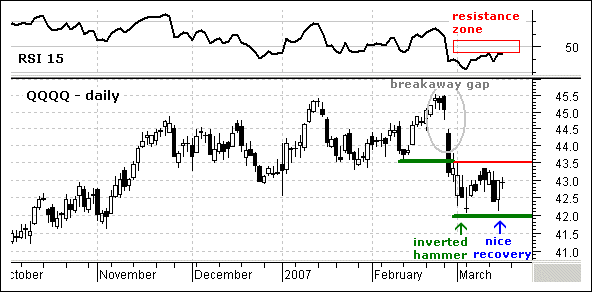
On the daily chart, QQQQ bounced off support at 42 forthe second time on Wednesday and then stalled below resistance at 43.5 on Thursday. A dojiformed on the day and the ETF is showing indecision below resistance. RSI is trading nearits resistance zone (45-55) as well and the ETF is at a moment-of-truth. A break above43.5 would be quite positive. The doji on the daily chart looks like a falling flag on the60 minute chart. The Wednesday rally back above broken support is impressive, but followthrough is required for a trend reversal. Namely, QQQQ needs to break above 43.1 to signala continuation of Wednesday’s rally. Failure here and a move below 42.7 would keepthe overall downtrend in place and call for at least a test of the prior low around 42.1.
Position: Short from 42.7 on 13-Mar. The flag provideslevels for the next trading decision. A break (up) to 43.15 would call for an exit ofshort and move into longs. A break (down) to 42.7 would call for shorts and target a moveto 42.1.
***S&P 500 ETF (SPY)***
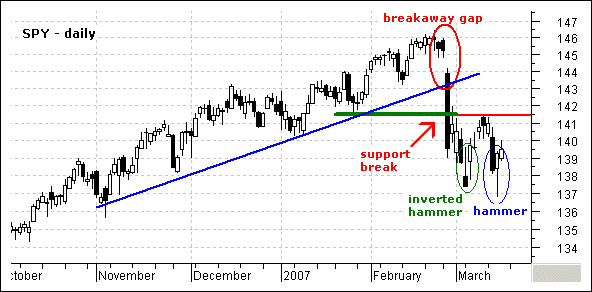
On the daily chart, SPY formed a hammer on Wednesday andfollow through on Thursday was not impressive. A little more enthusiasm is needed toconfirm this hammer. Namely, a break above 141.5 on good volume and breadth. Let’ssee it first. On the 60 minute chart, SPY returned to broken support at 140 and stalledyesterday. The stall looks like a flat flag and a break above 140 would signal acontinuation of the Wednesday afternoon advance. This would project a move above 141.5 anda breakout here could be used signal to anticipate a bigger breakout on the daily chart.Failure at resistance from broken support (140) and a move below the flag low would keepthe overall downtrend alive and target a move to support around 136.5-137.
Position: Short from 139.9 on 13-Mar. SPY is at itsmoment-of-truth. The flag is relatively tight and I will use these boundaries for the nextsignal. A break (up) to 140.1 would be short-term bullish and a break (down) to 138.9would be bearish.
***Russell 2000 iShares (IWM)***
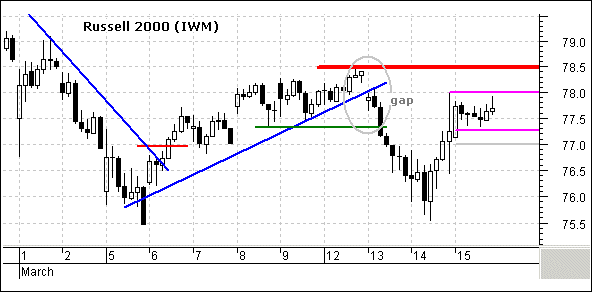
On the daily chart, IWM teased support on Wednesday andfollowed through on Thursday with a respectable advance. There is a ton of support around76, but it means little as long as IWM remains below resistance at 78.5. Bouncing offsupport is one thing (positive) and breaking through resistance is another (bullish).Let’s see a breakout before considering this support bounce bullish. On the 60 minutechart, IWM moved back above its support break and stalled just below the gap. A flat flagformed here too and a break above 78 would be short-term bullish. This would project amove above 78.5. Failure here and a move below 77 would be short-term bearish. I am using77 because I would like to see a move below the low of yesterday’s opening long whitecandlestick.
No position. IWM hit the stop-loss at 77.6 in the firsthour and this position resulted in a small loss. IWM is showing relative strength and Iwill be watching for a move to 78.1 for longs and 76.9 for shorts.
***Stock Setups***
~WAG Surges on Good Volume~ Not all patterns arepretty and perfect. It would be nice to have perfect flags and wedges, but sometimes thelines do not quite match up, there are overshoots and we need to draw through a low orhigh. A falling flag or wedge represents a consolidation or correction. The key is torecognize the “essence” of the pattern. Does it look like a fallingconsolidation/correction? I think the decline in WAG looks like a falling consolidation orcorrection. It follows a strong surge on good volume. The decline is orderly and theretracement is normal (50% of the prior advance). As such, I think that yesterday’ssurge on big volume signals an end to this correction and I now expect a continuation ofthe December surge. The upside target is 50 and a move to 43.8 would negate the signal.
Good day and good trading -Arthur Hill
---------------------------------------------------------------
Click here to posta comment, suggestion or question.
---------------------------------------------------------------
Disclaimer: Arthur Hill is not a registered investment advisor. The analysis presented isnot a solicitation to buy, avoid, sell or sell short any security. Anyone using thisanalysis does so at his or her own risk. Arthur Hill and TD Trader assume no liability forthe use of this analysis. There is no guarantee that the facts are accurate or that theanalysis presented will be correct. Past performance does not guarantee futureperformance. Arthur Hill may have positions in the securities analyzed and these may havebeen taken before or after the analysis was present.
--------------------------------------------------------
about: The Daily Swing is posted every trading day around 6AM ET and focuses on short-termstrategies for QQQQ, SPY and IWM. In addition, at two stock setups are featured every daywith a detailed trading strategy. As warranted, coverage extends to broad market topics,key sectors and industry groups and inter-market securities (gold, bonds, the Dollar andoil).
--------------------------------------------------------
Sources: Data from Bloomberg.com, CBOT.com, Kitco.com and ino.com; Charting from Metastock(equis.com). Closing data from Reuters.com, eSignal.com, MS QuoteCenter and Yahoo!Finance.


