 Normally, such a high reading is Bullish, but not always. I note that the IWM P/C's are very high too. That's correlated with good moves, alas, it's hard to know which way.
I suspect that this WWW will actually BE weird.

SPY P/C ratio
Started by
OEXCHAOS
, Apr 11 2007 07:20 AM
3 replies to this topic
#1

Posted 11 April 2007 - 07:20 AM
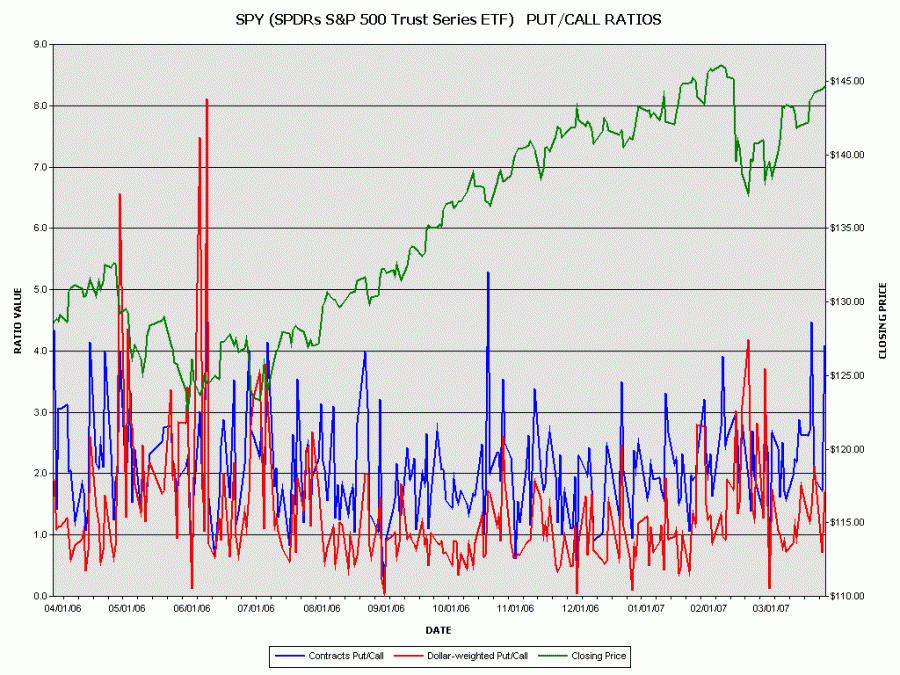
I've attached the chart of the Nominal and $-weighted SPY P/C.
 Normally, such a high reading is Bullish, but not always. I note that the IWM P/C's are very high too. That's correlated with good moves, alas, it's hard to know which way.
I suspect that this WWW will actually BE weird.
 Normally, such a high reading is Bullish, but not always. I note that the IWM P/C's are very high too. That's correlated with good moves, alas, it's hard to know which way.
I suspect that this WWW will actually BE weird.
Mark S Young
Wall Street Sentiment
Get a free trial here:
http://wallstreetsen...t.com/trial.htm
You can now follow me on twitter
#2

Posted 11 April 2007 - 08:53 AM
The OEX P/C spike typically leads to a selloff. The OEX MA's aren't yet in very high probability IT sell territory but they are getting close. Another P/C daily spike could do it--say an OEX P/C above 3 again.
Again, this indicator has been the most reliable indicator out there.
#3

Posted 11 April 2007 - 08:55 AM
You know I have the most shorts in the RUT options, I guess I represent the dumb money here...  I am buying also back the OIH and SMH options for the hedge.
HHH looks like a diamond reversal intraday now...
#4

Posted 11 April 2007 - 09:25 AM
I gave up on the hedging idea, it is dropping too fast...
... for now riding the trend lower. Keeping it simple, looking for the lower trendlines from connecting the lows...


