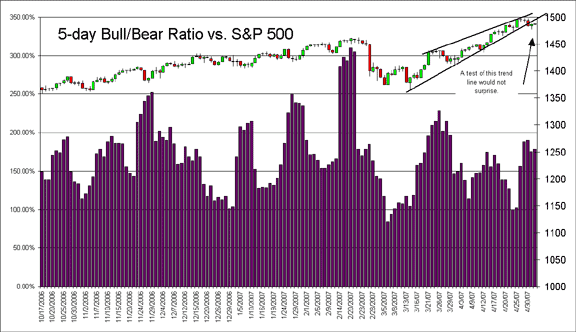
Click image above for larger image
Our T-4 Turn Indicator went out yesterday at 33 which is again well away from asignal and again amazingly low, especially for a Tuesday. This may be telling ussomething, but I'm not sure what. Be on the lookout for some frustrating action. The lastsignal was a Sell on 3/8. Typically we want to see readings above 80 or higher before welook for worthwhile turns. This indicator doesn't catch every top and bottom, but it is agreat "Heads up!" indicator. We'll provide a chart every time we get a highreading.
Options Sentiment
Daily P/C ratio: 1.16. Neutral.
10-day P/C ratio: 0.94. Neutral.
Equity P/C ratio: 0.70. Neutral.
OEX PC ratio: 1.50. Neutral.
OEX 10-day PC ratio: 1.46. Negative but almost neutral.
OEX $-weighted* P/C ratio: 1.45. Neutral.
QQQQ $-weighted* P/C ratio: 0.60. Neutral. Near a Sell.
ISEE Sentiment Index: 114. Neutral.
The options data are pretty neutral and we didn't get much Bearishness generated either.I'd say that the data support a bounce but also suggest that we might have more sellingcoming.
The ISEE Sentiment Index indicator is contrarian;traditionally, over 200 is too optimistic, under 100 too pessimistic. I've loosened that abit in recent months. Readings over 2.0 are Bullish and near 0.5 are Bearish. *$-weightedP/C data courtesy of Fari Hamzei.
General Public Polls
LowRisk reported 32% Bullish vs. 43% Bullish last week, and 41% Bearish vs. 43%Bearish the previous week. This is Bullish to see no acceptance of the rally at all. Thatmakes it hard to look for a top of any import. Last week, Investors Intelligence,reported that Bulls fell slightly to 51.10% vs. 52.70%, and Bears rose modestly to26.10% vs. 25.30%. This shift puts us just out of Sell territory, but still pretty close.I think that many advisors were looking for a pullback last week, and a few may havegotten carried away. This is not unexpected and should jump back into Sell territory thisweek. AAII reported 39.24% Bulls and 37.97% Bears vs. 46.94% Bulls and 29.59%Bears. This is showing big jump in Bearishness and that is Bullish for the market. Thistoo ought to pop more Bullish this week, but at this tells us that we are a long way awayfrom any sort of important top. Last week, Mark Hulbert reported that his HSNSI rosea bit to 34.1%. That's still a pretty low reading, barely up from our last report of23.9%. Last time, I had said that if this Bearishness persists (without any real weaknessdeveloping), it would imply deep seated and almost irrational Bearishness and thus will bevery Bullish for the market. Well, this shows that we've got higher prices ahead andunless something changes, we ought to buy the first pullback we see.
Rydex Sentiment
Rydex non-Dynamic Bull funds had $4MM (net) of outflows on a possible reversal day.The non-Dynamic Bear funds saw $1MM of (net) outflows. It looks like some amateurs justthrowing in the towel on both Bull and Bear funds. That's not Bearish but it's not reallyBullish given the ongoing exodus from these funds. Dynamic Funds saw net Bull fund buys of$23MM, and Bear fund net sells of $12MM. It looks like the Dynamic players were shiftingjust modestly Bullish. The RSO showed an $42MM Bullish asset shift on a possible reversalday. It appears that there's some Bullishness out there, though it's not excessive orinappropriate.
Conclusion
Last time, I said that I was looking for a bounce and then more serious weakness. Westarted the bounce yesterday and it appears that it's to follow on today. I was againhoping to get a clearer picture of the possible future price action from the sentiment butit's again not to be. The technicals haven't improved, and the sentiment has moved tonearly neutral, with plenty of aggressive Bulls and tentative Bears. The options aren'tmuch help and neither are the Rydex players. LowRisk, however shows declining Bulls in astrong market. That's a clue that there's plenty of latent Bearishness. We can't be tooBeared up here, at least as yet. I'd say that we'll probably bounce up and test the breakdown. We could go higher or just fail there. I'd like to say that a decline is in the baghere, but I can't. It's a toss up. Now, if we do get much of a decline, I'm a buyer, Ithink, unless we see rising Bullishness. Be on guard for some mercurial sentiment andtrading for that matter.
We do not have a ST Sentiment signal. Since we've been publishing our ST SentimentSignals, we've had 41 trades and 29 winners.
The Mechanical Senticator model went short at 149.64. The Subjective Senticator Model tooka half position there too. Add to this on strength to 149.70. Remember, these models musttrade in the direction of the Senticator or not at all.
Ideal ETF Portfolio (tracking portfolio):
100% Money Market.
We're flat. We are looking to re-enter either long on a pullback or short for acorrection.
Past performance is no guarantee of future returns.All information included in this missive is derived from sources we believe to bereliable, but no guarantee can be made to that effect. None of the forgoing should beconstrued as an offer or solicitation to buy or sell any security. The publisher may havea long or short position in the funds or securities discussed at any given time. We aren'tyour advisor, unless you have a signed contract with us. Please review any trade that youdo with your trusted advisor FIRST.
Note that we are also publishing on our private area on Traders-talk.com, too, for thosewho want on-line access to our charts and research and may be away from email.
For more on using the ISA and the various sentiment poll data, click
Mark Young
Editor
800-769-6980
859-393-3335


