This board has no patience with fundamental analysis, so how about cycles?

so-called parabolic spike-up in which arply for no reason other than their own momentum.
Started by
Islander
, Jun 03 2007 07:06 PM
4 replies to this topic
#2

Islander
-
- Traders-Talk User
- 2,551 posts
Member
Posted 03 June 2007 - 07:29 PM
This board has no patience with fundamental analysis, so how about cycles?
I was posting when I lost it. Sorry. I was recommending JH Ellis's book Ahead of the Curve. He suggests that when the GDP gets below 1% it is likely hear recovery in growth. So maybe the markets are looking for a recovery soon, like this fall. Consumers hold the clue - 70% of the market. The melt up I am suggesting will come is likely due to a parabolic spike-up based on Monentum. I don't like melt-ups, but I will set stops and take it. The book is on the web at www.aheadofthecurve-thebook.com.
Oh, yes I am often wrong, don't overlook that please. Best Islander, Unhappy

#3
Russ
-

- Traders-Talk User
- 7,199 posts
Member
Posted 03 June 2007 - 08:22 PM
Islander, I think we already had the melt up, actually its in progress, should end by June 26, then a late july bottom and buy time again. Latest off the press.
"Nulla tenaci invia est via" - Latin for "For the tenacious, no road is impossible".
"In order to master the markets, you must first master yourself" ... JP Morgan
"Most people lose money because they cannot admit they are wrong"... Martin Armstrong
http://marketvisions.blogspot.com/
"In order to master the markets, you must first master yourself" ... JP Morgan
"Most people lose money because they cannot admit they are wrong"... Martin Armstrong
http://marketvisions.blogspot.com/
#4
kc135a
-

- Traders-Talk User
- 501 posts
Member
Posted 03 June 2007 - 09:46 PM
This board has no patience with fundamental analysis, so how about cycles?
Take October 2014 and start backing up by 40 years +- 2 years. After the charts don't work pull up history books and read about the times.
I quit at 1734.
Check it out.
1734
1774
1814
1854
1894
1934
1974
2014?
Interesting economic conditions around those years.
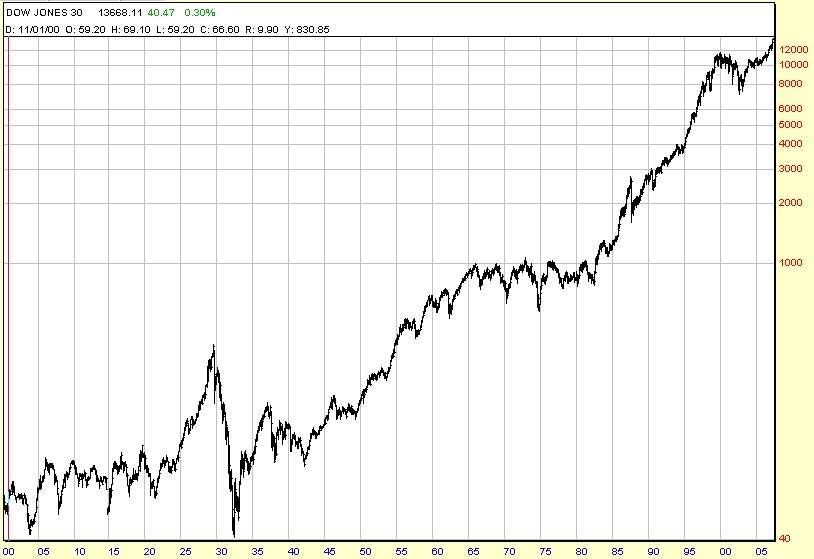
And for the ewavers count the below chart from 1932. I am curious what they come up with.
KC
#5
gm_general
-

- TT Member+
- 1,653 posts
Member
Posted 03 June 2007 - 10:51 PM
This board has no patience with fundamental analysis, so how about cycles?
Take October 2014 and start backing up by 40 years +- 2 years. After the charts don't work pull up history books and read about the times.
I quit at 1734.
Check it out.
1734
1774
1814
1854
1894
1934
1974
2014?
Interesting economic conditions around those years.
And for the ewavers count the below chart from 1932. I am curious what they come up with.
KC
Your comment struck a chord with me - We know that the birth cycle is 40 years long, with a usual ups and downs affecting the economic conditions as each generation enters/leaves its primary spending years. Could this have to do with that?


