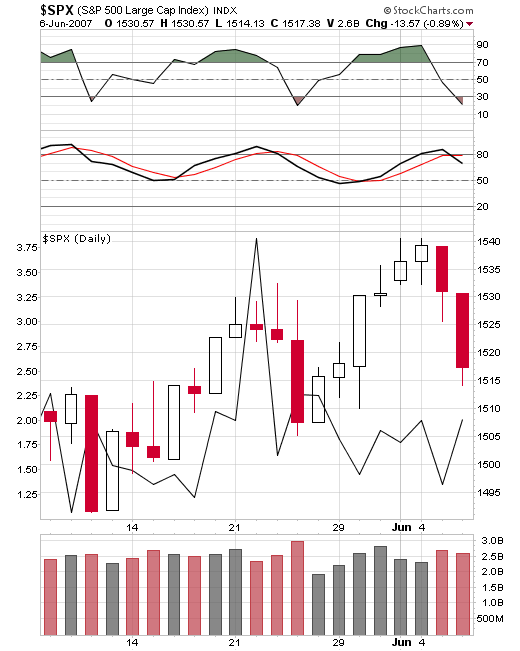

Last Friday's Dow High was
Started by
chris
, Jun 07 2007 11:50 AM
2 replies to this topic
#1

chris
-
- Traders-Talk User
- 172 posts
Member
Posted 07 June 2007 - 11:50 AM
a DeMark 13 count and a 1:1 ratio.
#2
Russ
-

- Traders-Talk User
- 7,204 posts
Member
Posted 07 June 2007 - 11:58 AM
Chris, What level would this method predict for the bottom of this move?
"Nulla tenaci invia est via" - Latin for "For the tenacious, no road is impossible".
"In order to master the markets, you must first master yourself" ... JP Morgan
"Most people lose money because they cannot admit they are wrong"... Martin Armstrong
http://marketvisions.blogspot.com/
"In order to master the markets, you must first master yourself" ... JP Morgan
"Most people lose money because they cannot admit they are wrong"... Martin Armstrong
http://marketvisions.blogspot.com/
#3
chris
-
- Traders-Talk User
- 172 posts
Member
Posted 07 June 2007 - 12:41 PM
Chris, What level would this method predict for the bottom of this move?
I'm not aware of any predictive method for a point level (and there is no time factor with his method). I just take it day by day with the counts, and use support and resistance levels, retracements, etc. (although DeMark's daily 13 count can be pretty powerful). This is also the 13th week of the upmove off the low, and almost a 1 year anniversary of the June '06 low. On a side note, it was interesting that the SP500 hit its 12th day the week before on May 22nd and coincided with the heavy Index put buying. This seems to happen more and more frequently as traders seem to be front-running the 13th day (which then doesn't happen because the next day closes below the previous two day close, instead of up). I was surprised that the Dow count worked exactly.