***Position Summary***
The PPI report came out yesterday and stocks reacted positive to the news that Core-PPI was tame. Give me a break. Finished consumer foods rose a whopping 8.5%, finished energy goods rose 7.2% and Core PPI rose 1.6%. Core PPI equals finished goods less foods and energy. Inflation sure looks tame without food and energy. Heck, my household budget would look at lot better without food and energy costs. However, food and energy costs are part of reality and both are rising fast. There are clearly signs of inflation and we have the Consumer Price Index due today. This is more important because this report reflects the burden on consumers. Judging by the surge in food and energy in the PPI, I would expect food and energy to also surge in the CPI. We now have high and rising interest rates, rising food costs and rising energy costs. This is going to affect consumer spending and we should not treat these reports as benign, even if “core” prices are in line. Core – schmore.
Regardless of what I think about inflation, interest rates and consumer spending, stocks are still trending up and showing strength. SPY and DIA bounced back over the last five days and the bulls are not letting go. QQQQ and IWM never broke down and remained in medium-term uptrends all along. The short-term trends for QQQQ and SPY are up and Thursday’s breakouts are holding. QQQQ, SPY and IWM gapped up yesterday morning and it is important that these gaps hold.
The stock setups page is updated on Tuesdays and Fridays. ***Click here***
***Technical Highlights***
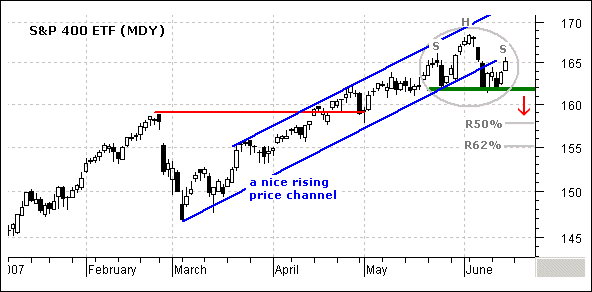
~Two In A Row~ Stocks made it two in a row as the major indices closed higher for the second straight day. The gains were modest with the S&P SmallCap Index and S&P MidCap Index leading the way higher. Volume was average on the Nasdaq and below average on the NYSE. The S&P Midcap ETF (MDY) has a small head-and-shoulders working over the last few weeks (gray circle). Neckline support is set at 162 and a move below this level would argue for a deeper correction towards 50-62% retracement marks. The bulls have the edge as long as 162 holds and the head-and-shoulders is unconfirmed.
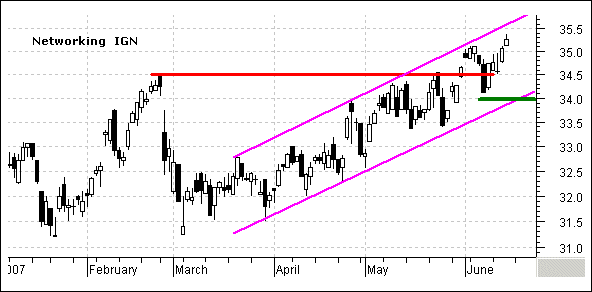
Eight of the nine sectors were higher with Energy leading the way. The Energy SPDR (XLE) was the only sector to gain more than 1%. The Finance SPDR (XLF) was the only sector to loose ground and this interest rate sensitive sector remains under pressure. 73 of the 100 Dow Jones Industry Groups were higher yesterday with Oil Services, Mining, Autos and Coal leading the way. The Networking iShares (IGN) is showing relative strength with a 52-week high yesterday. The ETF is one of the few trading above its early June highs. SPY, QQQQ and IM all remain below their early June highs. IGN is getting short-term overbought, but remains in a rising price channel with support at 34.
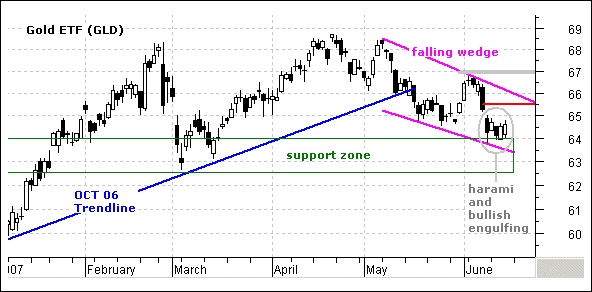
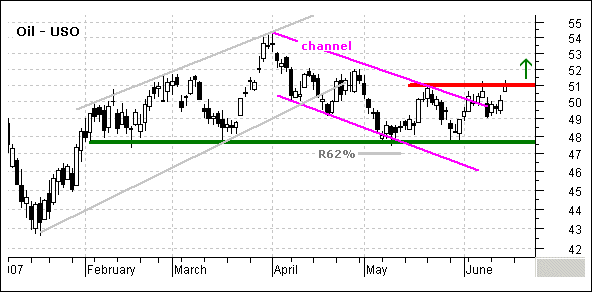
Except for oil, the inter-market arena was quiet on Thursday. Gold continued to firm at support. The US Dollar Index edged above 83 to keep its uptrend alive. Bonds fell back and the 10-year T-Note Yield edged back above 5.2%. The U.S. Oil Fund ETF (USO) gapped up and closed above 51. Energy stocks have been strong for months and it looks like USO is going to play some catch up here. The ETF broke the upper channel trendline in early June and exceeded its late May high. This calls for a continuation of the Jan-Mar advance and the upside target is around 60. The summer driving season is approaching and this would be helping the bid.
***Nasdaq 100 ETF (QQQQ)***
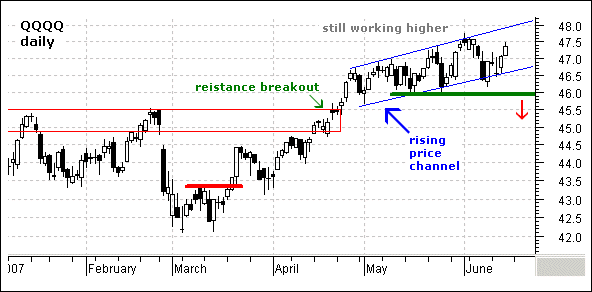
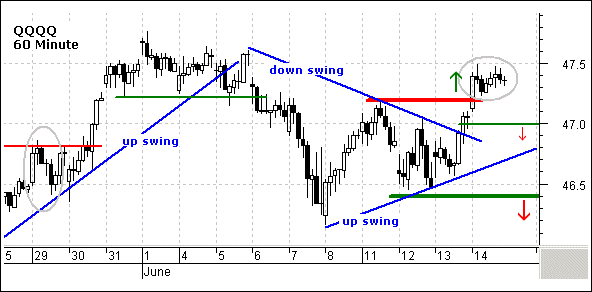
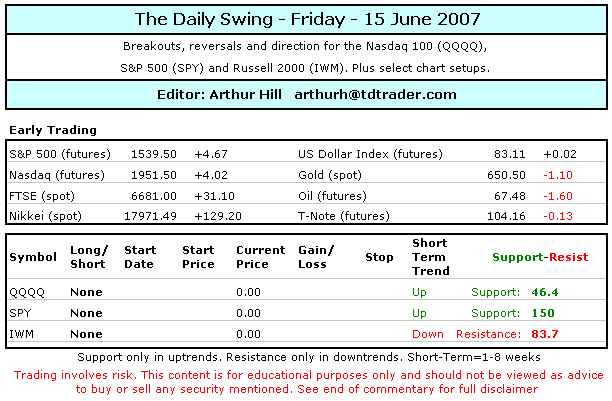
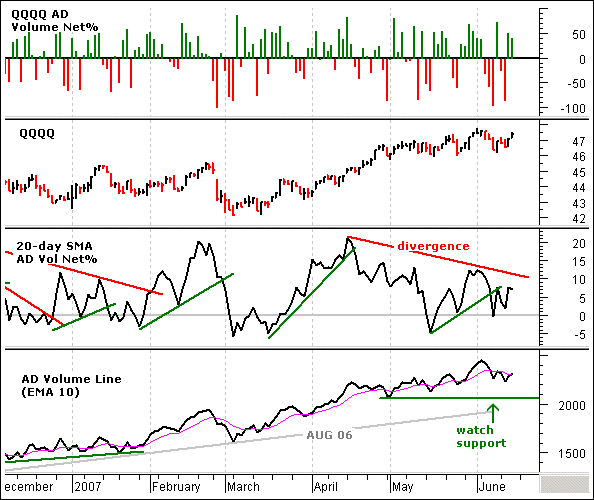
There is no change on the daily chart as QQQQ remains in a medium-term uptrend with key support at 46. On the 60 minute chart, QQQQ broke the downswing trendline late Wednesday and exceeded key resistance at 47.2 early Thursday. The ETF stalled after the breakout and consolidated around 47.2-47.5 (gray oval). This breakout should hold and I am marking minor support at 47. A move below this level would fill Thursday’s gap and challenge the breakout. This would be negative. As far as the short-term uptrend is concerned, I am watching key support at 46.4. A move below this level would break the upswing trendline and forge a lower low. This would signal a continuation of the prior decline (1-8 June) and target a move to around 45.5. As long as the short-term trend remains up, I would target a move towards the upper channel trendline on the daily chart (~48). Position: No position and no change. With the medium-term trend up and QQQQ breaking out on the 60 minute chart, my bias has switched to bullish. However, I still find the trading environment too choppy and will remain on the sidelines.
***S&P 500 ETF (SPY)***
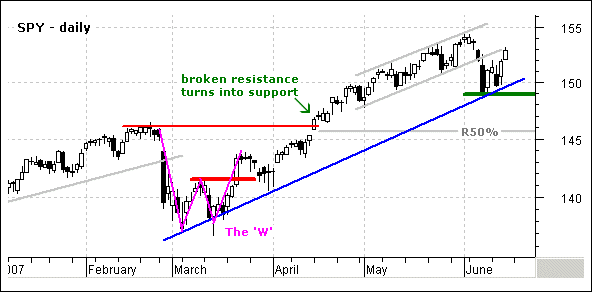
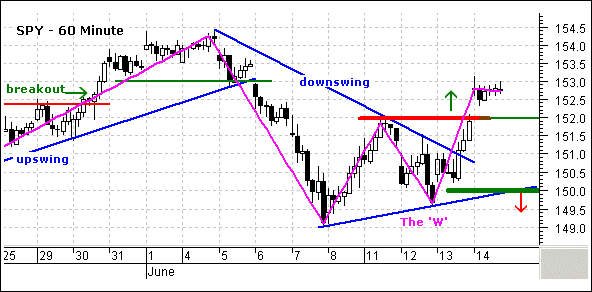
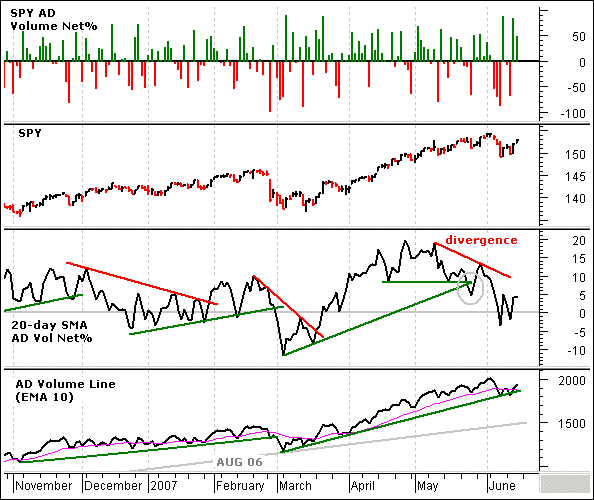
On the daily chart, SPY moved back above last Thursday’s high (long black candlestick) and this sharp decline has already been erased. Simply amazing. The break back above 151 was positive and forged a reaction low at 149. This is the first real reaction low since March. It serves as the basis for the March trendline and key support at 149. On the 60 minute chart, I have been comparing the “W” reversal with “W” reversal that formed in Feb-Mar on the daily chart. The breakout at 152 is short-term bullish and the upside target is to around 154-154.5 as long as it holds. SPY gapped up yesterday and a move below 152 would fill this gap. This would be negative, but I would not turn short-term bearish because key support is set at 150. A move below 150 would break the upswing trendline and totally erase this week’s gains. I would then look for a continuation of last week’s decline and target further weakness to around 148.
Position: No position and no change. With the ‘W’ patterns taking shape and the surge above 152, my bias has switched to bullish. Trading remains quite choppy though and I think the chances of whipsaw are above average.
***Russell 2000 iShares (IWM)***
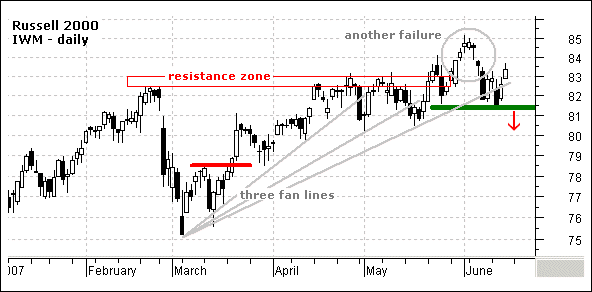
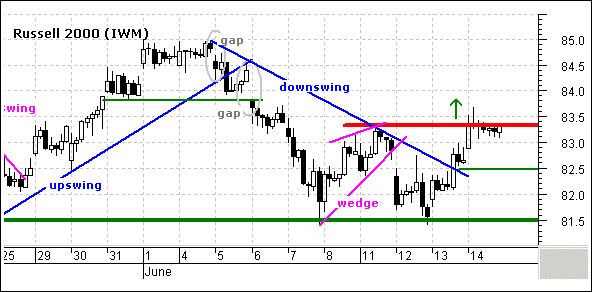
There is no change on the daily chart analysis. IWM bounced off support yesterday and the bulls still have the edge on the daily chart (medium-term trend). A battle is raging around support at 81.5 as the ETF trades above and below the third fan line. On the 60 minute chart, IWM surged to resistance at 83.4 and then consolidated the entire day. I guess resistance earned its keep yesterday. The ETF broke the downswing trendline and the surge off support looks pretty strong. Let’s wait for IWM to clear yesterday’s high before calling the short-term up. The ETF gapped up yesterday and I am marking minor support at 82.5. A move below this level would fill the gap and show weakness. The big level to watch is still 81.5 and a break below this support would be medium-term bearish. Position: No position and no change. IWM is quite tricky now because the medium-term trend has yet to reverse and the ETF is bouncing off support. It looks like a transition period and this means choppy trading ahead.
***Chart Setups***
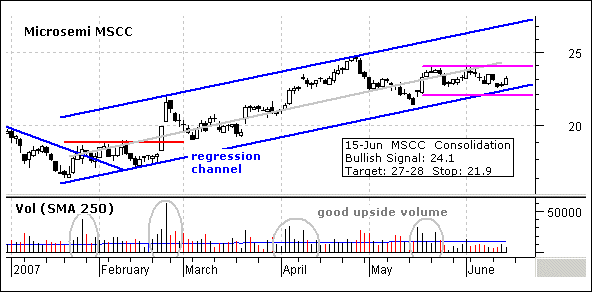
~MSCC Hits Regression Channel~ As its name implies, Microsemi is part the Semiconductor group and this group is key to the tech sector. I featured this stock on 22-Feb and it broke resistance at 19 that day. The stock has since worked its way higher and I drew a regression channel extending up from the January low. I could not get a trendline or normal price channel to fit so I drew the regression line (gray). The blue lines are parallel and MSCC is near support from the lower trendline. The stock has consolidated the last few weeks with support just above 22 and resistance at 24. A break above 24 would signal a continuation higher and I would look for a move towards the next resistance zone around 27-28. Failure to hold the breakout and a move below 22 would be bearish.
Good day and good trading -Arthur Hill
---------------------------------------------------------------
Click here to post a comment, suggestion or question.
Breadth Charts ---------------------------------
---------------------------------------------------------------
Disclaimer: Arthur Hill is not a registered investment advisor. The analysis presented is not a solicitation to buy, avoid, sell or sell short any security. Anyone using this analysis does so at his or her own risk. Arthur Hill and TD Trader assume no liability for the use of this analysis. There is no guarantee that the facts are accurate or that the analysis presented will be correct. Past performance does not guarantee future performance. Arthur Hill may have positions in the securities analyzed and these may have been taken before or after the analysis was present.
--------------------------------------------------------
about: The Daily Swing is posted every trading day around 6AM ET and focuses on short-term strategies for QQQQ, SPY and IWM. In addition, at two stock setups are featured every day with a detailed trading strategy. As warranted, coverage extends to broad market topics, key sectors and industry groups and inter-market securities (gold, bonds, the Dollar and oil).
--------------------------------------------------------
Sources: Data from Bloomberg.com, CBOT.com, Kitco.com and ino.com; Charting from Metastock (equis.com). Closing data from Reuters.com, eSignal.com, MS QuoteCenter and Yahoo! Finance.


