Edited by norton, 20 June 2007 - 09:29 PM.

If this then likely that
Started by
norton
, Jun 20 2007 09:24 PM
5 replies to this topic
#1

norton
-
- TT Member
- 1,000 posts
Member
Posted 20 June 2007 - 09:24 PM
All sustained bull runs in various markets have the same problem for market timers, as compared to perma bulls or in this case buy hold and forget about it investors - and that is what to do when a sell off occurs. In this case the sell off is particularly interesting because it happened right after the gap up caused by the positive report, and price wise the gap up was into the heart of previous resistance, specifically the mid 1550's using the Sept S&P as the leading heavily traded indicator. We are now trading nicely below the bullish news buying "opportunity", on a day when there was no major economic bad news, in fact with crude down nicely, in spite of a positive influence. So, the timing seems right to me that this downturn should not be used to go long. IF we do continue to decline from here, then what? Well, past sell offs of significance have been around 80-90 S&P points, which would target around 1470 in the Sept contract. This fits in nicely with that level being April's resistance, which would then be a possible future support level. IF the market does decline from here through the summer to around that level, and IF the cash NYSE at that time coincides with being against a previous swing low, then I would assume the downturn would be over and time to cover shorts and look closely at getting long. For now, I am short from 1540 a few days ago, I believe we could be in a temporary bear void this summer, and will look to stay short per the above imaginary scenario. Otherwise, my stop on my shorts for now is 1552.
In other news, the Board of Trade is on fire with great bull moves happening right now in Wheat, Soybeans and Corn.
The dollar continues to drift a little higher, putting downward pressure on gold and silver. More a time than a price objective bull market correction, it seems mid August is a seasonal time to look to go long the metals again.
Please, help stamp out vibration.
#2
MS B
-

- Traders-Talk User
- 5 posts
Member
Posted 20 June 2007 - 09:34 PM
Norton, Thank you. Very clear & to the point.
I've missed your posting, hope you do more.
 B
B
B
#3
U.F.O.
-

- TT Patron+
- 5,605 posts
U.F.O.
Posted 20 June 2007 - 09:39 PM
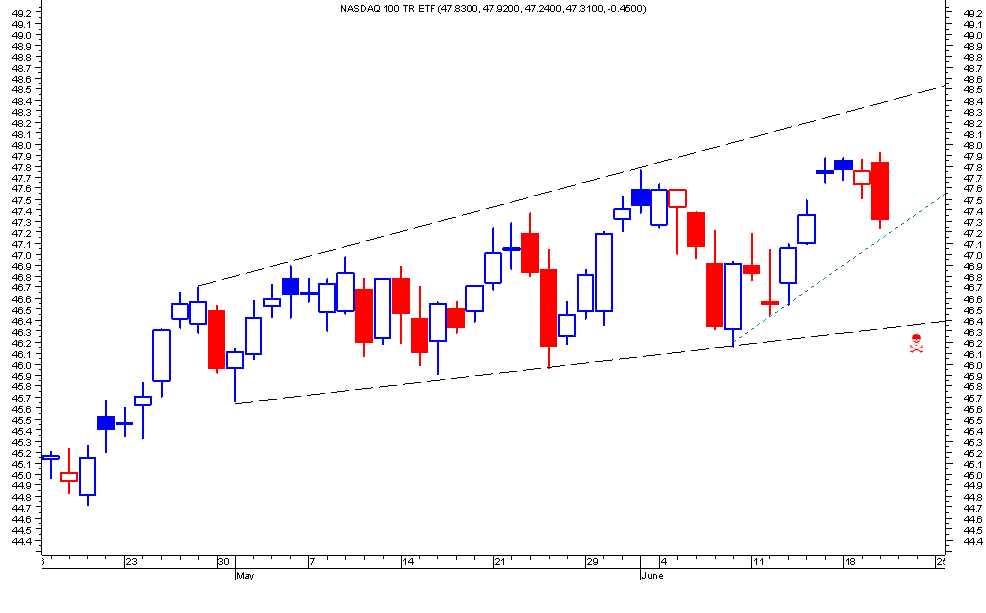
Nice post norton. I'm not a short-seller yet, but am watching the Q's for further breakdown. Lot of negative divergences out there and have been for a good chunk of this rally. Before I'd load up short I'd need to see a crack of triangle support about a point below. (1 chart)
U.F.O.
U.F.O.
"Democracy is two wolves and a lamb voting on what to have for lunch. Liberty is a well-armed lamb contesting the vote!"
~Benjamin Franklin~
~Benjamin Franklin~
#4
Russ
-

- Traders-Talk User
- 7,199 posts
Member
Posted 21 June 2007 - 12:16 AM
From what I have read expanding triangles usually or maybe always eventually break down below the bottom line.
"Nulla tenaci invia est via" - Latin for "For the tenacious, no road is impossible".
"In order to master the markets, you must first master yourself" ... JP Morgan
"Most people lose money because they cannot admit they are wrong"... Martin Armstrong
http://marketvisions.blogspot.com/
"In order to master the markets, you must first master yourself" ... JP Morgan
"Most people lose money because they cannot admit they are wrong"... Martin Armstrong
http://marketvisions.blogspot.com/
#5
bobalou
-

- Traders-Talk User
- 1,878 posts
Member
Posted 21 June 2007 - 06:16 AM
I'm w/ ufo's chart,not broke yet. I'm flat and day trading,till the end of mo. my vhf chart could have a high to fill then,then I'll add a short for a I T ,nice
#6
Tor
-

- Traders-Talk User
- 7,647 posts
Member
Posted 21 June 2007 - 08:17 AM
All sustained bull runs in various markets have the same problem for market timers, as compared to perma bulls or in this case buy hold and forget about it investors - and that is what to do when a sell off occurs. In this case the sell off is particularly interesting because it happened right after the gap up caused by the positive report, and price wise the gap up was into the heart of previous resistance, specifically the mid 1550's using the Sept S&P as the leading heavily traded indicator. We are now trading nicely below the bullish news buying "opportunity", on a day when there was no major economic bad news, in fact with crude down nicely, in spite of a positive influence. So, the timing seems right to me that this downturn should not be used to go long. IF we do continue to decline from here, then what? Well, past sell offs of significance have been around 80-90 S&P points, which would target around 1470 in the Sept contract. This fits in nicely with that level being April's resistance, which would then be a possible future support level. IF the market does decline from here through the summer to around that level, and IF the cash NYSE at that time coincides with being against a previous swing low, then I would assume the downturn would be over and time to cover shorts and look closely at getting long. For now, I am short from 1540 a few days ago, I believe we could be in a temporary bear void this summer, and will look to stay short per the above imaginary scenario. Otherwise, my stop on my shorts for now is 1552.
In other news, the Board of Trade is on fire with great bull moves happening right now in Wheat, Soybeans and Corn.
The dollar continues to drift a little higher, putting downward pressure on gold and silver. More a time than a price objective bull market correction, it seems mid August is a seasonal time to look to go long the metals again.
Yes, that is correct.
Other points to mention however are that metals are potentially topping here, take a look at the charts. Not PM's where the reverse may be true. I have some IT signals kicking in on the downside on SPX below 1487 closing basis. Maybe that will prove a headfake on your figures will see.
Observer
The future is 90% present and 10% vision.
The future is 90% present and 10% vision.


