

$RUT will kill bears tomorrow
Started by
spielchekr
, Jul 25 2007 07:53 PM
5 replies to this topic
#1

spielchekr
-
- Traders-Talk User
- 3,104 posts
Member
Posted 25 July 2007 - 07:53 PM
There's was no lack of compressed index charts today. This one made me cover all shorts at the Rydex AM fix.
#2
selecto
-

- Traders-Talk User
- 6,871 posts
Member
#3
spielchekr
-
- Traders-Talk User
- 3,104 posts
Member
Posted 25 July 2007 - 08:20 PM
Lot of distribution going on.
In my mind, there's no doubt about it. Distribution of entire inventories at the highest possible prices until the cupboards are bare is the motive. Pump, dump, repeat.
Edited by spielchekr, 25 July 2007 - 08:21 PM.
#4
ogm
-

- Traders-Talk User
- 13,780 posts
Member
Posted 25 July 2007 - 08:22 PM
I agree, we got a bit oversold here. Bounce is imminent. But, that said... longer term charts are set up for continuing decline, so selling bounces here is the right strategy, IMO. Cover on strong down moves, sell into rallies.
We might go as far up as close that gap and test the channel center line from below. That would be ideal spot to sell into. If we get that far.
Edited by ogm, 25 July 2007 - 08:23 PM.
#5
Curt
-

- Traders-Talk User
- 24 posts
Member
Posted 25 July 2007 - 08:29 PM
I think your channel TA looks sound, in and of itself.
But maybe you don't think Feb 27 can ever repeat?  2/26 also sat at the bottom of the channel, then.
BTW the summation, tick and clo are just like feb 26, today. Quoting another group: there are other cycles in play that have 8/3 as the low, for a powerful bounce to 8/8 which is the high over looking a steep drop off to the end of Aug, after which a several month rally will ensue.
I'm just mentioning this because I've found this group to be the best forecasters I've found free or paid: Yahoo group TimeandCycles.
curt
2/26 also sat at the bottom of the channel, then.
BTW the summation, tick and clo are just like feb 26, today. Quoting another group: there are other cycles in play that have 8/3 as the low, for a powerful bounce to 8/8 which is the high over looking a steep drop off to the end of Aug, after which a several month rally will ensue.
I'm just mentioning this because I've found this group to be the best forecasters I've found free or paid: Yahoo group TimeandCycles.
curt
#6
spielchekr
-
- Traders-Talk User
- 3,104 posts
Member
Posted 25 July 2007 - 08:47 PM
An interesting seasonal chart I found at the TSP site. I'm don't know if
"1988-present" means through last December. If somebody wants to
front-run this, they've got the setup.
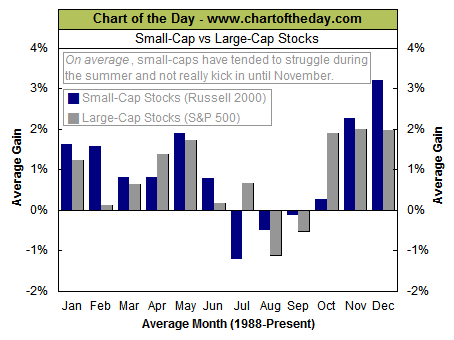
"1988-present" means through last December. If somebody wants to
front-run this, they've got the setup.


