
***Position Summary***
Stocks dropped like a rock over the last six days and this decline is looking similar to the late February – early March decline when SPY lost 5.8% in five days. Given the severity of the current decline, it will take a few days for the dust to settle and it is time to step back for a while. There is no sense rushing into longs or shorts at this time.
The medium-term trend for IWM is down and small-caps are leading the way lower. QQQQ and big techs held up quite well yesterday and the medium-term trend for QQQQ remains up. SPY finished the day right at key support on the daily chart. Needless to day, the short-term trends are down and oversold. There is a bullish setup in QQQQ, but IWM and SPY can only hope for oversold bounces at this stage. I remain short IWM and will tighten my stop for the remaining position. As far as stock setups, I am featuring a consolidation breakout today, but I am holding off on new positions for a day or two. The stock setups page has been updated today.
The stock setups page is updated on Tuesdays and Fridays. ***Click here***
***Technical Highlights***
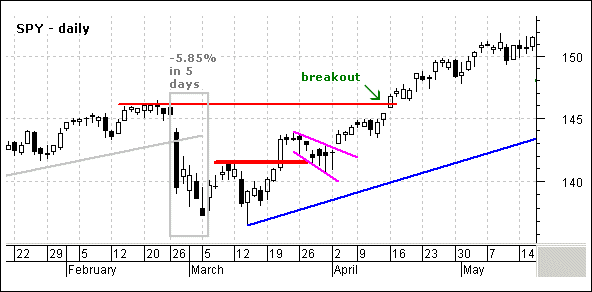
~Blood in the Streets~ Stocks started weak and declined throughout the day on Thursday. All of the major indices were down sharpl with the NYSE Composite (-2.78%) and Russell 2000 (-2.59%) leading the way. The NYSE Composite was whacked by the Finance sector and relative weakness in small-caps weighed on the Russell 2000. The Nasdaq 100 held up the best with a 1.22% gain and QQQQ bounced off its lows. Once again, large techs are showing relative strength. Nasdaq volume was the highest since June 2006 and NYSE volume was the highest since July 2002!
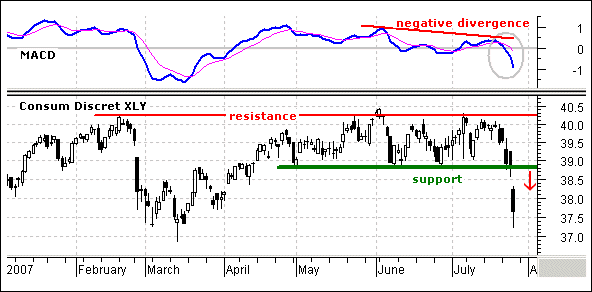
All sectors were down with Finance and Materials leading the way. Both were down over 3%. Consumer Staples and Technology held up the best and finished down around 1.5%. 98 of the 100 Dow Jones Industry Groups were down in a virtual route. Computer Hardware and Transportation Services were the only two groups to gain. Biotechs lost the least with a decline of .59% and strength here can be attributed to Genentech (DNA). Biotechs and Techs do not have much direct exposure to the sub-prime problems. In contrast, the Consumer Discretionary SPDR (XLY) broke support with a gap down and this is medium-term bearish. The gap and support break turn into resistance and a move back above 39 would show resilience. Don’t hold your breadth though. Retail stocks have more direct exposure to the sub-prime problems and this will surely put a damper on consumer spending.
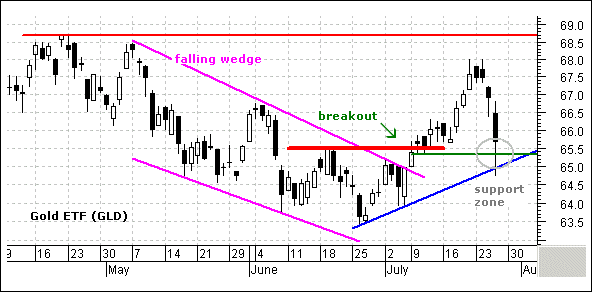
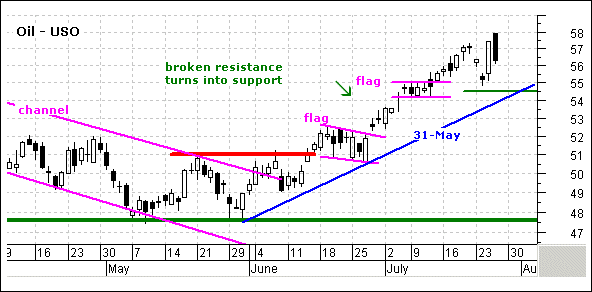
In inter-market action on Thursday, bonds surged in a flight to quality, the U.S. Oil Fund ETF (USO) opened strong and closed weak, the US Dollar Index moved lower and gold declined sharply. As noted yesterday, the StreetTracks Gold ETF (GLD) has support around 65.5 from broken resistance and the June trendline. The ETF pierced 65 during the day, but recovered and closed above 65.5. The U.S. Oil Fund ETF (USO) opened strong and closed weak to form a dark cloud pattern over the last two days. These short-term bearish reversal patterns require confirmation with further weakness and a break below 54.5 would be short-term bearish. Until then, USO remains in an uptrend and oil is strong.
***Nasdaq 100 ETF (QQQQ)***
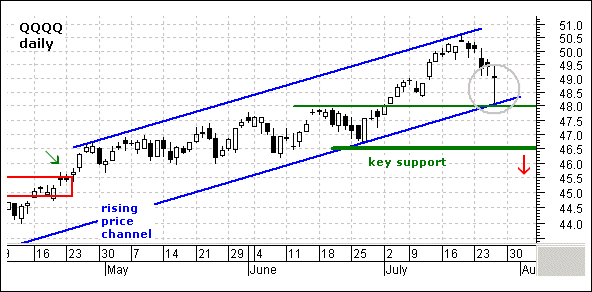
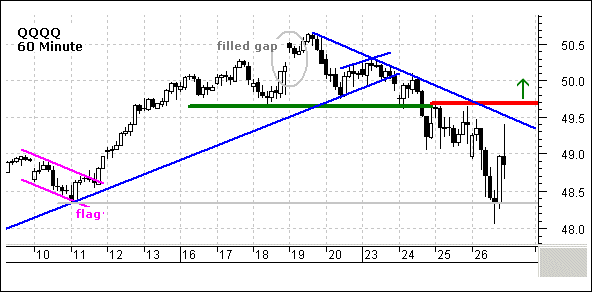
Considering the carnage on the rest of Wall Street, QQQQ actually held up pretty good with a big doji on Thursday. The ETF opened around 49, dipped to 48 and rallied back to 49 by the close. QQQQ bounced off support at 48 and this keeps the medium-term uptrend in place. The rising price channel and support from broken resistance held. On the 60 minute chart, QQQQ declined over the last five days and the short-term trend remains down. Broken support at 49.6 turns into resistance around 49.7 and a break above this level would reverse the short-term downtrend. This would also break the 19-Jul trendline.
Position: No position. QQQQ is holding up well and we still have a bullish setup in the works with a break above 49.7. However, there are two many negative undercurrents at work in other parts of the market and I will remain on the sidelines for this ETF.
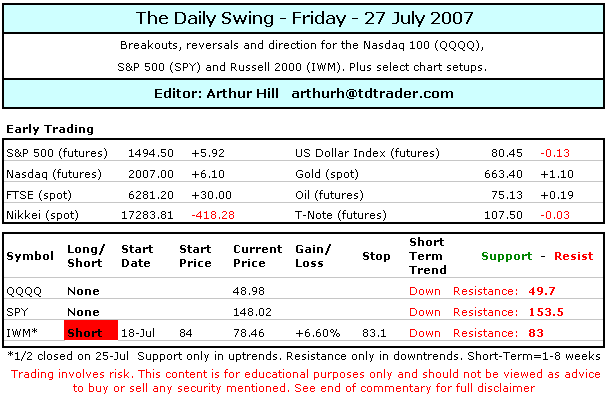
***S&P 500 ETF (SPY)***
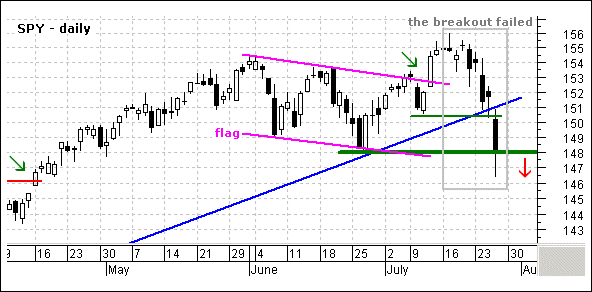
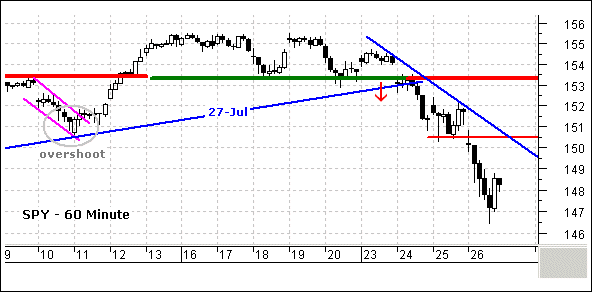
SPY broke minor support at 150.5 and declined to key support at 148. The ETF closed at 148.02 and this support level is holding by a whisker. Nevertheless, the early July breakout failed miserably and the decline over the last six days is unlikely to reverse on a dime. In addition, the Finance and Consumer Discretionary sectors are leading the way lower and SPY is not going far with these two showing relative weakness. On the 60 minute chart, SPY broke key support at 153.5 and declined sharply over the last three days. The ETF is getting oversold after an eight point (5%) decline in four days (~155 to ~147). Broken support at 150.5 turns into resistance and this is the first level to watch for a rebound. While a move back above this level would be bullish, I would consider it an oversold bounce and not worthy of a play. Expect a peak between 151 and 153.
Position: No position. The medium-term trend is on the verge of turning bearish and this will open the door to short positions. Now it not a good time for shorts with the ETF short-term oversold and at medium-term support.
***Russell 2000 iShares (IWM)***
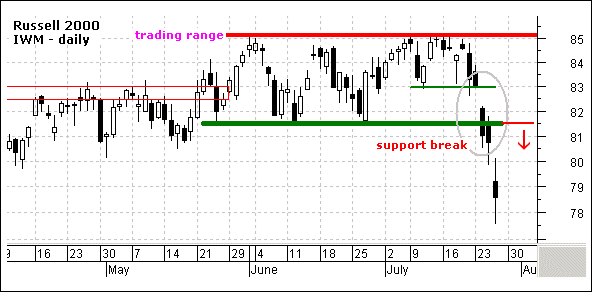
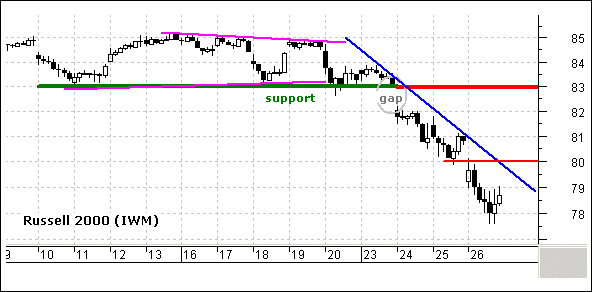
IWM broke trading range support on Tuesday and continued lower the last two days. There were essentially two gaps in the last three days and both held. The breakdown is medium-term bearish and broken support turns into resistance around 81.5. This is the first level to watch on any rebound. On the 60 minute chart, IWM broke support at 83 and never looked back. The ETF is down seven points (8%) in the last five days and short-term oversold. It is entirely possible that the ETF remains oversold and bounces could be limited to 1-2 points. Minor resistance is set at 80 and a move above this level would argue for a counter trend rally. However, I would not play this rally and would expect a peak between 80 and 83.
Position: Short from 84 on 18-Jul. I remain bearish on IWM, but the ETF is getting short-term oversold and ripe for either a consolidation or a bounce. Set stop for the remainder at 83.1. 1/2 of this position was closed on 25-Jul.
***Chart Setups***
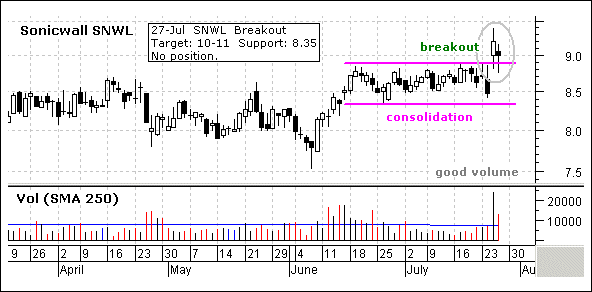
~SNWL Breaks Consolidation~ SonicWall (SNWL) engages in the design, development, manufacture, and sale of integrated network security, mobility, and productivity solutions for small to medium size networks (Yahoo! Finance). On the price chart, the stock surged in June and then formed a tight consolidation. SNWL reported good earnings on Wednesday and the stock broke resistance with good volume. I also saw similar breakouts in RFMD, VIGN and AMSG. The breakout in SonicWall is bullish and the upside target is to the next resistance zone around 10-11. A move below consolidation support would negate this signal. While the breakout is there, I am going to lay low for a day or two and let the current market chaos settle before making new trades.
Good day and good trading -Arthur Hill
---------------------------------------------------------------
Click here to post a comment, suggestion or question.
Breadth Charts ---------------------------------
---------------------------------------------------------------
Disclaimer: Arthur Hill is not a registered investment advisor. The analysis presented is not a solicitation to buy, avoid, sell or sell short any security. Anyone using this analysis does so at his or her own risk. Arthur Hill and TD Trader assume no liability for the use of this analysis. There is no guarantee that the facts are accurate or that the analysis presented will be correct. Past performance does not guarantee future performance. Arthur Hill may have positions in the securities analyzed and these may have been taken before or after the analysis was present.
--------------------------------------------------------
about: The Daily Swing is posted every trading day around 6AM ET and focuses on short-term strategies for QQQQ, SPY and IWM. In addition, at two stock setups are featured every day with a detailed trading strategy. As warranted, coverage extends to broad market topics, key sectors and industry groups and inter-market securities (gold, bonds, the Dollar and oil).
--------------------------------------------------------
Sources: Data from Bloomberg.com, CBOT.com, Kitco.com and ino.com; Charting from Metastock (equis.com). Closing data from Reuters.com, eSignal.com, MS QuoteCenter and Yahoo! Finance.


