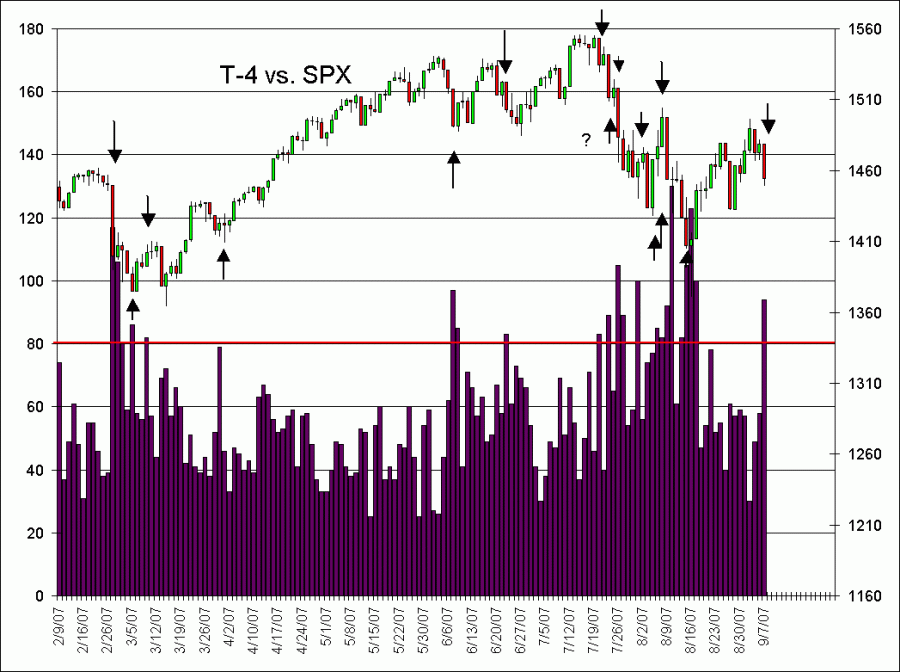

T-4 Signal?
#1

Posted 09 September 2007 - 11:35 AM
Mark S Young
Wall Street Sentiment
Get a free trial here:
http://wallstreetsen...t.com/trial.htm
You can now follow me on twitter
#2

Posted 09 September 2007 - 11:44 AM
#3

Posted 09 September 2007 - 12:33 PM
I have sells on 6 of 8 of my "internals" screens (except nasi and bp, which are pokey).
Intraday looks like a bounce Monday, but when the 60 min rolls everybody and their brother is going to sell it. (FF
Watch the neckline:
http://stockcharts.c...6748&r=5505.png
Edited by selecto, 09 September 2007 - 12:39 PM.
#4

Posted 09 September 2007 - 08:33 PM
#5

Posted 09 September 2007 - 08:41 PM
#6

Posted 09 September 2007 - 08:54 PM
#7

Posted 09 September 2007 - 10:43 PM
#8

Posted 10 September 2007 - 09:41 AM
#9

Posted 10 September 2007 - 10:58 AM
I recall a rather long and detail discussion on another board about the Commercials.
I believe the conclusion was that while the commercials are usually right, they are also
usually early. That fits in here, by my (present) view.
selecto,
Ordinarily I'd agree. What we are seeing now is beyond abnormal, especially in a historical context.
SPX big...(com)mercial net long near 4 yr high (missed correction completely)
SPX mini....com net long at 'ridiculous' levels--nearly twice historical record (missed correction)
NDX both...com basically long but within historical norms
R2K big...com long but in middle of range
R2K mini...com wildly, ridiculoulsly long (about 5 times previous historical record)
When you look beyond equitiy index futures there are several more abnormalities. Commercial activity in the 2 yr and 10yr treasuries has been well outside of historical extremes. Com activity in the Nikkei and a few currencies has been mildly abnormal. Also, their has been quite a bit more volatility in other products (commodities, etc).
I don't know what all of this means. However, using COT com data in a 'traditional' manner has been very unprofittable. Also, the extremes tell me we could see quite a bit of volatility in the markets in both direcdtions.


