Jump to content


Photo

LT wave update


  • This topic is locked This topic is locked
9 replies to this topic

#1 LarryT

LarryT

    Member

  • Traders-Talk User
  • 1,066 posts

Posted 23 September 2007 - 02:21 PM

Three charts from 1932, 2002 and daily from 2007 low. This is my favored wave structure until the market proves me wrong by taking out 1605 on soild technical values. If you simply look at what has happened to our country since 2000 it is easy to see it is being destroyed from within.

070923_1.gif

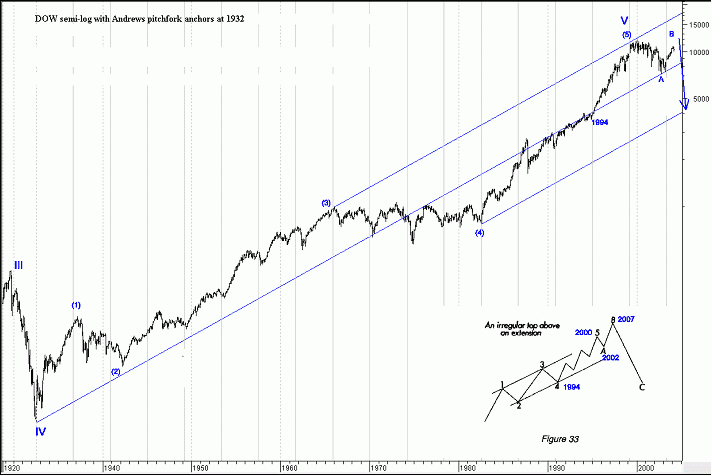
This chart from 1932 displays the very long term wave count for the entire history of America. Wave II was the mid 1800s Civil War era, a lengthy complex shallow correction. The crash of 1929 was a wave IV steep, simple and fast decline. World War II was the wave (2) of V, the Vietnam War was wave (4) of V, and Gulf War was wave 2 of (5) of V. The orthodox end of America occurred at the year 2000 market top. Since the year 2000 high our Politics have collapsed as the 2000 election was a total disaster, our Military has invaded a sovereign country for pre-emptive purposes and our standard of living is collapsing as we send our manufacturing base overseas. Our currency has collapsed since the 2000 top and the NASDAQ market dropped 95%. It is very easy to see how America is falling apart since the 2000 top. Price wise the orthodox top of an extended market is never the ultimate price top. It requires many years to form the first "A" wave down and the new high "B" wave. Time is now seven years into this process that may be complete at the July 19th high or we have one higher high in November before the real bear market selling begins.

In the lower RH corner the pattern for an irregular wave "AB" top is displayed from the Master works of RN Elliott. Two rules to be aware of with this pattern. An extension is never the price end, the wave "B" will be a higher high and once wave "B" is complete price quickly returns to the level where the extension began which is 1994s year of trading.

I placed the dates on the pattern to display where the market is at in the pattern. The wave "B" top is either in at the 1550s or it continues up to 1605 by November. Notice the pattern calls for wave "C" to drop to the area of the next lower degree wave 4? That indicates once this "B" wave has topped and the five waves down "C" gets underway the market will drop to the 1994 price zone.
070923_2.gif

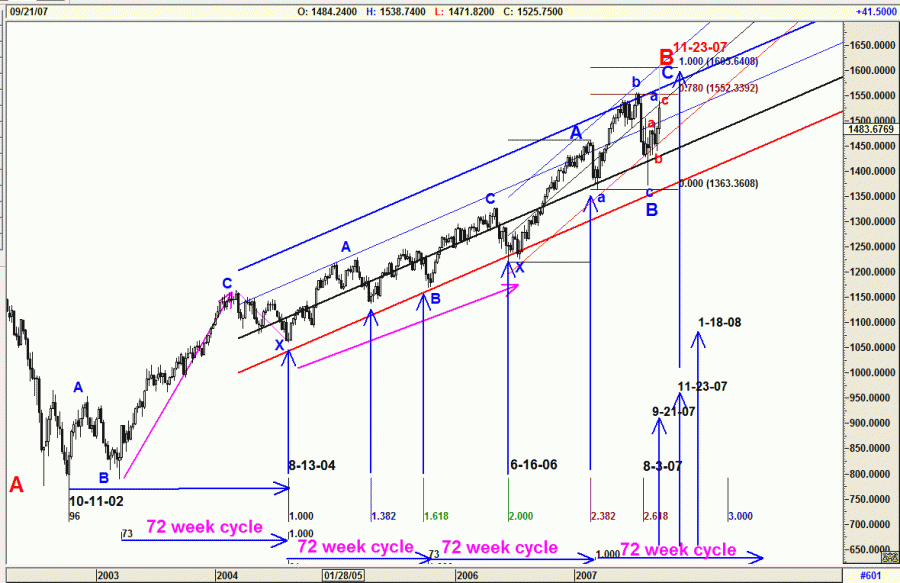
This chart breaks down the market advance from the wave "A" low of 2002. The basis for the analysis comes from Fibonacci time extensions based on the October 2002 low and the March 2003 low and Jims 360 day cycle or in weeks 72 weeks. The March 2003 low is a combined 9 month or 180 day half cycle of the 360 day cycle. At the 1.382 extension we see the 9 month low and at 1.618 we see another combined 72 week/9 month low. At the 2.0 extension another 9 month half cycle low and at 2.382 another combined 72 week/9 months low in June 2006.

Now we get to the bottom line 72 week cycle analysis from June 2006. If we simply do a Fibonacci time breakdown of 72 weeks the .382 date is the week of 9-21-07. The .50 date is the week of 11-23-07 and the .618 date is the week of 1-18-08. Friday was the .50 date so we either break below 1490 support this week or it holds and we continue on up toward 1605 by 11-23-07.
070923_3.gif

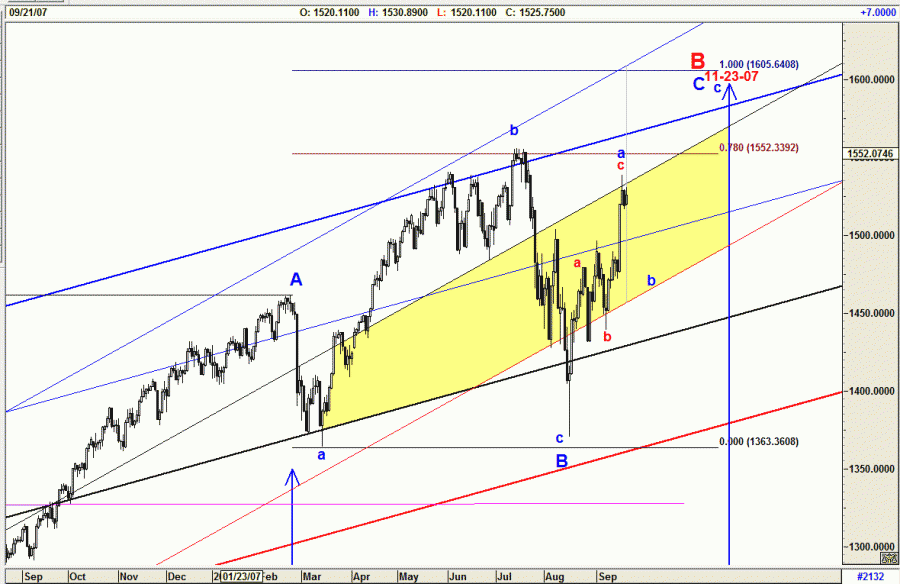
This daily chart zooms in on 2007. From the 2006 low we have two Fibonacci price targets for the "B" wave top. The .78 1550s area and the 1.0 at 1605. From the 1370 August low we have wave 1524 and 1540 as price targets. The 1540 level was achieved Wednesday as the index peeked above the 2006 low regression line. The normal expectation for this pattern would see a drop near the red lower channel line with 1470s as solid support.

Bottom line; the analysis on these pages calls for the orthodox end of the growth expansion of America from the 1700s to year 2000 is now in the final days of an irregular new high wave "B" with 1605 in November as that target price time high. The pattern then calls for a five waves down wave "C" that will not bottom until it trades into the 1994 price range.

Got Gold?


http://marketcharts....ad.com/WAV.html
"If you are going to be dumb you gotta be tough"

Twitter site

d:^)

#2 Russ

Russ

    Member

  • Traders-Talk User
  • 7,201 posts

Posted 23 September 2007 - 03:21 PM

Larry, Why are you still posting a long dow chart with a count that has now been proven wrong since the dow went above the 2000 highs?
"Nulla tenaci invia est via" - Latin for "For the tenacious, no road is impossible".
"In order to master the markets, you must first master yourself" ... JP Morgan
"Most people lose money because they cannot admit they are wrong"... Martin Armstrong


http://marketvisions.blogspot.com/

#3 LarryT

LarryT

    Member

  • Traders-Talk User
  • 1,066 posts

Posted 23 September 2007 - 03:40 PM

Larry, Why are you still posting a long dow chart with a count that has now been proven wrong since the dow went above the 2000 highs?


Russ, you obviously did not read the text. The wave count is not wrong, it is exactly correct. An extension is always retraced by a higher price than the wave "V" price high. Look at the lower RH corner of the chart and note the irregular B wave new high pattern from the master works of RN Elliott. Wave B always goes to a higher high in bear market wave patterns which this one has done. The extension began in 1994. The pattern also states the "C" wave will drop back into the 1994 price zone in five waves.

If you will read the text and think about what has happened to our country since 2000 it is easy to see how the wave down from 2000 to 2002 is wave A and the rally to new highs is a B wave not an impulsive wave. The B wave is either topped at the .78 extension 1550s or it can go to the C = A target at 1605 from the 2006 low.

Larry
"If you are going to be dumb you gotta be tough"

Twitter site

d:^)

#4 Russ

Russ

    Member

  • Traders-Talk User
  • 7,201 posts

Posted 23 September 2007 - 04:07 PM

Larry, Why are you still posting a long dow chart with a count that has now been proven wrong since the dow went above the 2000 highs?


Russ, you obviously did not read the text. The wave count is not wrong, it is exactly correct. An extension is always retraced by a higher price than the wave "V" price high. Look at the lower RH corner of the chart and note the irregular B wave new high pattern from the master works of RN Elliott. Wave B always goes to a higher high in bear market wave patterns which this one has done. The extension began in 1994. The pattern also states the "C" wave will drop back into the 1994 price zone in five waves.

If you will read the text and think about what has happened to our country since 2000 it is easy to see how the wave down from 2000 to 2002 is wave A and the rally to new highs is a B wave not an impulsive wave. The B wave is either topped at the .78 extension 1550s or it can go to the C = A target at 1605 from the 2006 low.

Larry


Larry, I did look at what you wrote quickly but how valid is an extension type count? Certainly Don Wolanchuk does not see it that way.

Airedale88 is looking for spx 1670-1700 on this current bull run. Many would agree that Airedale88 is about as good as it gets.
http://www.traders-t...?...=76502&st=0

Don Wolanchuk is looking for Dow 20,000 and more. I have indications that the Dow will keep going up into the latter part of the next decade, that is not to say there will not be a recession before then though.

But who knows maybe you will be right...I have my doubts.

Russ
"Nulla tenaci invia est via" - Latin for "For the tenacious, no road is impossible".
"In order to master the markets, you must first master yourself" ... JP Morgan
"Most people lose money because they cannot admit they are wrong"... Martin Armstrong


http://marketvisions.blogspot.com/

#5 LarryT

LarryT

    Member

  • Traders-Talk User
  • 1,066 posts

Posted 23 September 2007 - 04:22 PM

But who knows maybe you will be right...I have my doubts.

Russ


OK, to have doubts, like I said until the market proves me wrong that is my read. The good news is we will find out who is right real soon. The DOW has three wave targets for an irregular B wave new high. They are wave A distance times 1.0, 1.382 and 1.618 added to wave A low of 7197. The 1.0 is of course not the high, 1.382 at 13,510 was not the top and 1.618 at 14,588 remains short term valid.

Be alert,

Larry
"If you are going to be dumb you gotta be tough"

Twitter site

d:^)

#6 Russ

Russ

    Member

  • Traders-Talk User
  • 7,201 posts

Posted 23 September 2007 - 05:00 PM

I know the US debt is out of control and as Dr. Marc Faber says if Fed Chairman Bernanke keeps printing paper the Dow could go to 100,000 but the dollar could lose 99.9% of its value. At this point things don't look too promising for the USA in the long run. Martin Armstrong's long forecast debt crisis nightmare is unfolding.

http://www.resourcei....asp?relid=7220
"Nulla tenaci invia est via" - Latin for "For the tenacious, no road is impossible".
"In order to master the markets, you must first master yourself" ... JP Morgan
"Most people lose money because they cannot admit they are wrong"... Martin Armstrong


http://marketvisions.blogspot.com/

#7 Russ

Russ

    Member

  • Traders-Talk User
  • 7,201 posts

Posted 23 September 2007 - 06:17 PM

"My point is simply this: When emerging markets will break down sometime within the next 9 months the US stockmarket is likely to out-perform foreign markets." Dr. Marc Faber Sept. 10, 2007 www.boomgloomdoom.com

This coming from Dr. Doom himself.

http://www.ameinfo.com/131614.html
"Nulla tenaci invia est via" - Latin for "For the tenacious, no road is impossible".
"In order to master the markets, you must first master yourself" ... JP Morgan
"Most people lose money because they cannot admit they are wrong"... Martin Armstrong


http://marketvisions.blogspot.com/

#8 da_cheif

da_cheif

    Member

  • Traders-Talk User
  • 10,964 posts

Posted 23 September 2007 - 08:27 PM

1997 saw the 5th of one...as u shud all recall at the 1997 hi prechter proclaimed 5 of 5 of 5 was complete and that a crash to end all crashes was to begin....the weekly ad line peaked....and started to decline dramaticly......and bottomed an abc decline in march 2000 ...from there the weekly ad line of the primary market started its epicenter of primary wave 3 up...in the mean time the narrowly based indexes were in the middle of their irregular flat corrections.....wave A into the 1998 lows.....wave B to their 2000 highs ....wave C to the 2002 lows......while all this was going on the majority of stocks as measured by the weekly ad line were going nuts........during that time i was being blasted for missing something.....that was the farthest from the truth......it was the so called geniuses who missed it all......from 1987 to the present...nothing much has changed.......only 2 that i know of is looking for the epicenter of primary wave 3 up.....me and Dent....and how do i know that the epicenter of primary wave 3 up is before us????....simple....what hasnt happened yet is still in the future isnt it......lol......and who shud know better then me about all this.....go ahead....name one.........snort

#9 mss

mss

    I'M WATCHING

  • TT Sponsor
  • 6,182 posts

Posted 23 September 2007 - 09:29 PM

I am sorry but you are wrong, those are facts and I could list a lot more facts that have happened since 2000.

It is still politics and is a violation of the TS. You dont get it do you. Does not matter if its truth or BS it is still political.
mss
WOMEN & CATS WILL DO AS THEY PLEASE, AND MEN & DOGS SHOULD GET USED TO THE IDEA.
A DOG ALWAYS OFFERS UNCONDITIONAL LOVE. CATS HAVE TO THINK ABOUT IT!!

#10 OEXCHAOS

OEXCHAOS

    Mark S. Young

  • Admin
  • 22,036 posts

Posted 23 September 2007 - 10:37 PM

Yup. Political. Bad idea. Don't expect subtile judgement from moi tonight. I'm a blunt instrument. With love, respect, and admonishment to respect the possibly differing politics or philosophy of your fellow poster. None of THAT matters. What matters are the technicals and how we can make money. None of the former matters. XO's to mss for remembering the good fight and holding to it despite all emotional reasons to deviate. Mark

Mark S Young
Wall Street Sentiment
Get a free trial here:
http://wallstreetsen...t.com/trial.htm
You can now follow me on twitter