A great place to identify reversals is through the use of Japanese candlestick patterns.
Now there are many candlestick patterns - and not just bearish ones. Let me go through afew of the bearish ones here:
Abandoned Baby
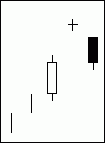
Like most of the three day star patterns, the scenarios are similar. The primarydifference is that the star (second day) can reflect greater deterioration in the priortrend, depending on whether it gaps, is a Doji, and so on.
Advance Block
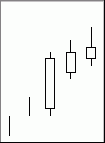
The Advance Block pattern is a derivative of the Three
Belt Hold
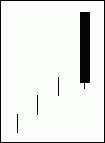
The market is trending when a significant gap in the direction of trend occurs on theopen. From that point, the market neverlooks back: all further price action that day is the opposite of the previous trend. Thiscauses much concern and many positions will be covered or sold, which will help accentuatethe reversal.
Break Away
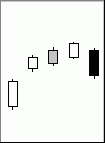
It is important to realize what is being accomplished here. The trend has accelerated witha big gap and then starts to fizzle, but it still moves in the
Dark Cloud Cover
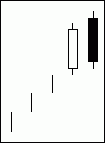
The market is an uptrend. Typical in an uptrend, a long white candlestick is formed. Thenext day the market gaps higher on the opening, however, that is all that is remaining tothe uptrend. The day after, the market drops to close well into the body of the white day,in fact, below its midpoint. Anyone who was bullish would certainly have to rethink theirstrategy with this type of action. Like the Piercing Line, a significant reversal of trendhas occurred.
Deliberation
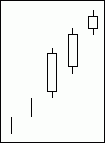
This pattern exhibits a weakness similar to the Advance Block pattern in that it gets weakin a short period of time. The difference is that the weakness occurs all at once on thethird day. The Deliberation pattern occurs after a sustained upward move and shows thattrends cannot last forever. As with the Advance Block, defining the deterioration of thetrend can be difficult.
Downside Gap Three Methods
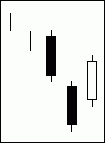
The market is moving strongly downward. This move is extended further by another day thatgaps even more in the direction of the trend. The third day opens well into the body ofthe second day, then completely fills the gap. This gap-closing move should be looked uponas supporting for the current uptrend. Gaps normally provide excellent support and/orresistance points when considered after a reasonable period of time. Because this gap isfilled within one day, some other considerations should be made. If this is the first gapof a move, then the reaction (third day) can be considered as profit taking.
Downside Tasuki Gap
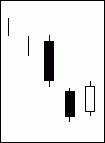
The psychology behind a Tasuki Gap is quite simple: Go with the trend of the gap. Thecorrection day (the third day) did not fill the gap and the previous trend shouldcontinue. This is looked upon as temporary profit taking. The Japanese widely follow gaps(windows). Therefore, the fact that the gap does not get filled or closed means that theprevious trend should continue.
Engulfing
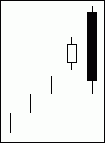
An uptrend is in place when a small white body day occurs with not much volume. The nextday, prices open at new highs and then quickly sell off. The sell-off is sustained by highvolume and finally closes below the open of the previous day. Emotionally, the uptrend hasbeen damaged. If the next third) days prices remain lower, a major reversal of the uptrendhas occurred.
Evening Star
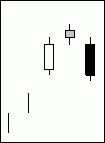
An uptrend has been in place which is assisted by a long white candlestick. There islittle doubt about the uptrend continuing with this type of action. The next day pricesgap higher on the open, trade within a small range and close near their open. This smallbody shows the beginning of indecision. The next day the prices gap lower on the open andthen close still lower. A significant reversal of trend has occurred.
Evening Doji Star
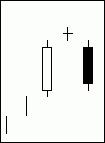
The psychology behind this pattern is similar to that of the Evening star, except that theDoji Star is more of a shock to the previous trend and, therefore, more significant.
Falling Three Methods
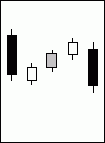
The Falling Three Methods pattern is considered a rest from trading. The psychology behinda move like this is that some doubt creeps in about the ability of the trend to continue.This doubt increases as the small-range reaction days take place. However, once the bearssee that a new high cannot be made, the bearishness is resumed and new lows are setquickly.
Hanging Man
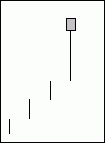
For the Hanging Man, the market is considered bullish because of the uptrend. In order forthe hanging man to appear, the price action for the day must trade much lower than whereit opened, then rally to close near the high. This is what causes the long lower shadowwhich shows how the market just might begin a sell-off. If the market opens lower the nextday, there would be many participants with long positions that would want to look for anopportunity to sell. Steve Nison claims that a confirmation that the hanging man isbearish might be that the body is black and the next day opens lower.
Harami
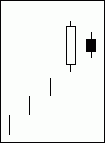
An uptrend is in place and is perpetuated with a long white day and high volume. The nextday, prices open lower and stay in a small range throughout the day, closing even lower,but still within the previous day’s body. In view of this sudden deterioration oftrend, traders should become concerned about the strength of this market, especially ifvolume is light. It certainly appears that the trend is about to change. Confirmation onthe third day would be a lower close.
Harami Cross
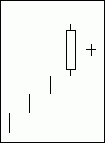
The Harami Cross starts out the
Identical Three Crows
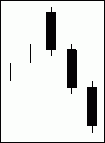
This pattern resembles a panic selling that should cause additional downside action. Eachday’s close sets a benchmark for opening prices the next trading day. There is atotal absence of buying power in this pattern.
In Neck
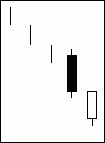
The scenario is almost identical to the On Neck Line, except that the downtrend may notcontinue quite as abruptly because of the somewhat higher close.
Long Legged Doji

The Long Legged Doji has long upper and lower shadows with the open and the close veryclose or the
Low Price Gapping Play

The Low Price Gapping Play is the bearish counterpart of the High Price Gapping Play, andleads a renewed fall out of a stalled downtrend. The pattern this forms is a downsidewindow from a low-price congestion band. After a sharp decline the market consolidates viaa series of real small bodies near the recent lows. If prices gap under this consolidationit is a sell signal.
Meeting Lines

There exists an almost opposite relationship for the bearish Meeting Line relative to theDark Cloud Cover pattern. The bearish Meeting Line opens at a new high and then closes atthe
On Neck

The On Neck Line usually appears during a decline. Bearishness is increased with the longblack first day. The market gaps down on the second day, but cannot continue thedowntrend. As the market rallies, it is stopped at the previous day’s low price. Thismust be uncomfortable for the bottom fishers who go into the market that day. Thedowntrend should continue shortly.
Separating Lines

While the market is in a downtrend, the forming of a long white body should be cause forconcern for the bears, since this shows signs of a possible rally. However, the next dayopens much lower, in fact, it opens at the previous white days opening price. Prices thenmove lower for the rest of the day and close lower, which suggests that the priordowntrend should continue.
Shooting Star

During an uptrend, the market gaps open, rallies to a new high, and then closes near itslow. This action, following a gap up, can only be considered as bearish.
Side By Side

A downtrend is further enhanced with a long black candle line followed by a large downwardgap open on the next day. The market trades higher all day, but not high enough to closethe gap. The third day opens lower, at about the
Three Black Crows

The market is either approaching a top or has been at a high level for some time. Adecisive trend move to the downside is made with a long black day. The next two days areaccompanied by further erosion in prices caused by much selling and profit taking. Thistype of price action has to take its toll on the bullish mentality.
Three Inside Down

This pattern, being a confirmation for the Bearish Harami, can only show the success ofthe forecast. The Bearish Three Inside Down is a confirmation pattern for the BearishHarami. Its pattern is defined by the first two days of the three day pattern forming aBearish Harami, and the third day giving support to the suggested reversal of the Harami,by being a black candle closing with a new low for the three days.
Three Line Strike

The market has continued in its trend, aided by the recent Three Black Crows pattern. Thefourth day opens in the direction of the trend, but profit taking or short covering causesthe market to move strongly in the opposite direction. This action causes considerablesoul searching, but remember that this move completely eradicated the previous three days.This surely dried up the short-term reversal sentiment and the trend should continue inits previous direction.
Three Outside Down

These patterns, representing the confirmation of the Bearish Engulfing pattern, can onlyshow the success of the forecast.
Thrusting

Much like the On Neck and In Neck Lines, the Thrusting Line represents a failure to rallyin a down market. Because of this failure, the bulls will be discouraged and a lack ofbuying will let the downtrend continue.
Tri Star

The market has probably been in an uptrend for a long time. With the trend starting toshow weakness, bodies probably are becoming smaller. The first Doji would causeconsiderable concern. The second Doji would indicate that there was no direction left inthe market. Finally, the third Doji would put the last nail in the coffin of the trend.This is essentially because this pattern indicates too much indecision, and everyone withany conviction would be reversing positions.
Two Crows

The market has had an extended up move. A gap higher followed by a lower close for thesecond day shows that there is some weakness in the rally. The third day opens higher, butnot above the open of the previous day, and then sells off. The sell-off closes well intothe body of the first day. This action fills the gap after only the second day. Thebullishness has to be eroded quickly.
Upside Gap Two Crows

Like the beginning of most bearish reversal patterns a white body day occurs in anuptrend. The next day opens with a higher gap, fails to rally and closes lower forming ablack day. This is not too worrisome because it still did not get lower than the firstdays close. On the third day prices gap to a higher open and then drop to close lower thanthe previous days close. This closing price, however, is still above the close of thewhite first day. The bullishness is bound to subside. How can you have two successivelylower closes and still be a raging bull?
Regards,


