Posted 12 October 2007 - 07:44 AM
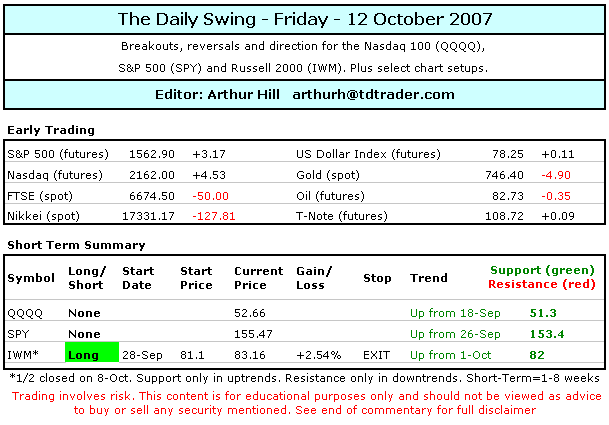
***Position Summary***
Let the volatility begin. It is October, the major index ETFs are up substantially over the last two months and earnings season is here. This is not a time for weak stomachs. The medium-term trends for IWM, QQQQ and SPY remain up and yesterday's reversal is not enough to even challenge the August trendlines. However, yesterday's reversal shows the nervous nature of the market and its vulnerability. Stocks have come a long way since mid August and a lot of good news is already factored into prices. While there may be good news in tech land, news from other sectors (retail and banking) has not been good. Moreover, there are a number of key groups lagging and this makes me put an asterisk next to the uptrend. The easy money was made from mid August until 10-Oct and now comes the hard part.
The stock setups page is updated on Tuesdays and Fridays. ***Click here***
***Technical Highlights***
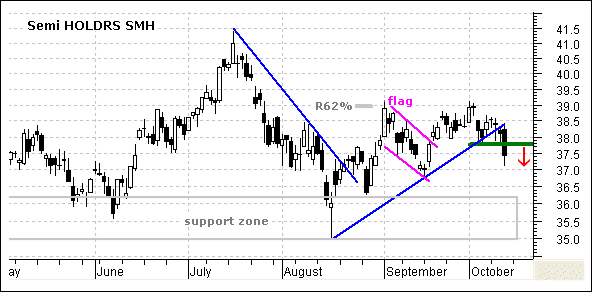
~Spooked~ Halloween came early to the market yesterday as intraday gains suddenly turned into closing losses. Stocks started the day strong with the major index ETFs gapping higher. The gains held until 2PM and then the bottom fell out. Seven of the nine sectors were lower with Healthcare and Technology leading the way down. Utilities and Consumer Staples managed gains as money turned to defense. The semis were especially hard hit as the Semiconductor HOLDRS (SMH) lost 1.79%. NYSE volume was average, but Nasdaq volume was above average. How do you like that? We finally get some volume in the market and it happens on a reversal day. With the dip in equities, money turned to bonds and iShares 20+ Year Bond ETF (TLT) rallied in the afternoon to close well off its lows for the day. Gold move higher and oil surge almost 2%.
~The Reversal~ The media scrambled for a specific reason, but there was no consensus and an array of excuses were offered. I can think of a few good reasons for a selloff. First, the market was clearly overbought and ripe for a pullback. Second, oil surged back above $80. Third, retail sales stink and consumer spending drives 2/3 of GDP. Fourth, the Finance sector and Banking group continue to lag. Volume has been below average since mid August and it only take a small increase in selling pressure to force a big move.
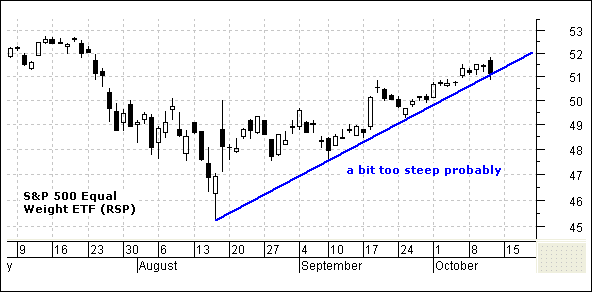
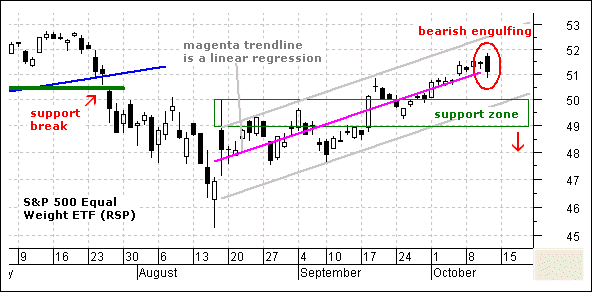
The chart above shows the S&P 500 Equal Weight ETF (RSP) with a bearish engulfing. This is short-term bearish candlestick pattern that requires confirmation. "Short-term" is the operative (hyphenated) word here and the medium-term trend is still up. I could draw a trendline extending up from the August low, but this line would be too steep. Instead, I drew a linear regression (magenta trendline) from the August low to the October high (closing). Next I drew upper and lower trendlines parallel and this forms the rising channel. Broken resistance around 49-50 turns into support and the lower channel trendline confirms support around 50. This would be the spot to expect support and a pullback to the 49.5-50 area is the place to look for buy-the-dip opportunities.
~XLU Breakout Holding~ The Utilities SPDR (XLU) formed a doji yesterday, but managed to hold its gains and finish in positive territory. The ETF broke the May trendline with a surge in mid September and then broke megaphone resistance over the last five days. RSI is trending higher and above 50. This ETF remains in bull mode as long as the lower trendline and key support at 39.5 hold.
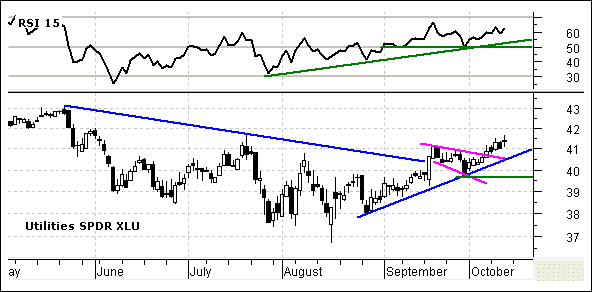
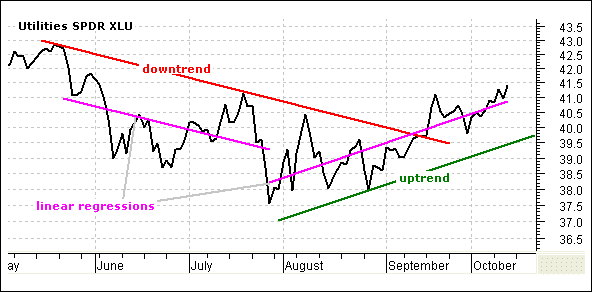
The second chart shows XLU with two linear regression channels. The magenta trendlines are the linear regressions and these are based on closing prices. Based on the regressions, the upper parallel trendline (red) represents the downtrend and the ETF reversed the downtrend in mid September. The green parallel trendline represents the uptrend and this trendline marks support at 39.5. This uptrend is valid until a close below the green trendline.
~Media Quote of the Day~ The following is from Bob Pisani's blog at CNBC:
No love from the stock market today, and frankly, not even the most rabid bulls (and I am bullish) can complain. Think about it:
- --September retail sales were even worse than was thought; many retailers lowered earnings;
- --energy stocks lowered earnings yesterday.
- --financials lowered earnings last week.
- --third quarter S&P 500 earnings estimates have gone to ZERO (the lowest in five years).
- --and the Dow and the S&P are at new highs???
My Comment: The last line says it all. The Dow and S&P 500 are near new highs with all this bad news. Something's got to give. Either the retail and finance situation is going to turn around drastically or the market is going to correct.
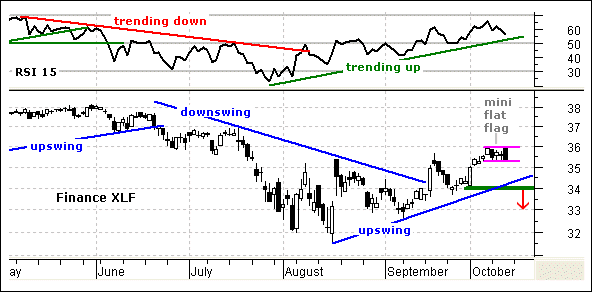
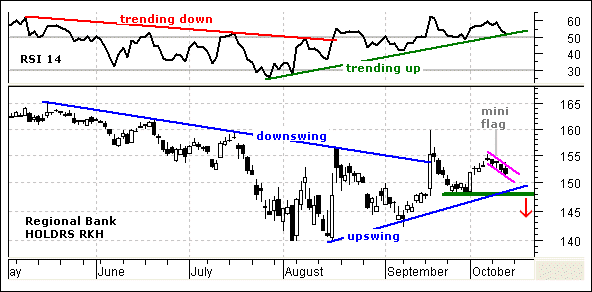
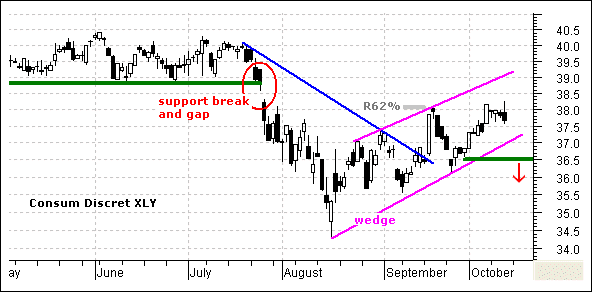
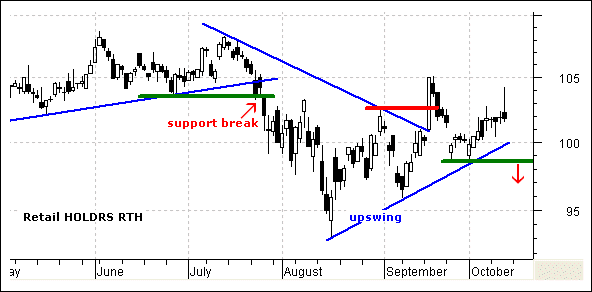
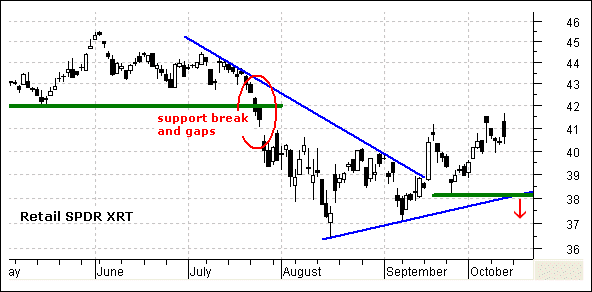
~The Weaklings Revisited~ It's a broken record, but continued weakness in XLF, XLY, RKH, SMH, RTH, XRT and IYT is not a good sign for the overall market. At the very least, relative weakness in these sector and industry group ETFs confirms that the market is NOT firing on all cylinders. Talk about a disconnect! These ETFs are lagging because they are well below their July highs. Not a little below. Well below. SMH broke down and is now in bear mode. The others are still trending higher since mid August, but these uptrends are not strong and we should be watching key support levels close.
~ANF Hits Resistance~ Abercrombie & Fitch (ANF) is a clothing retailer and part of the Consumer Discretionary sector. The stock defied relative weakness in the retail group with a move to its May highs. ANF surged the first two days of October and then stalled the last eight days. The overall trend remains up and this consolidation looks like a flag of sorts. These are normally bullish patterns, but we should also be on guard for support break at 82. The company reported a 4% decline in same store sales for September and a 1% gain in overall sales for the month. The numbers are not great and relative weakness in the retail group could pull this stock down. I would like some exposure to the short side and will add this stock to the stock setups portfolio. This is a top pick and the target is around 75. The initial stop-loss will be set at 86.1.
***Nasdaq 100 ETF (QQQQ)***
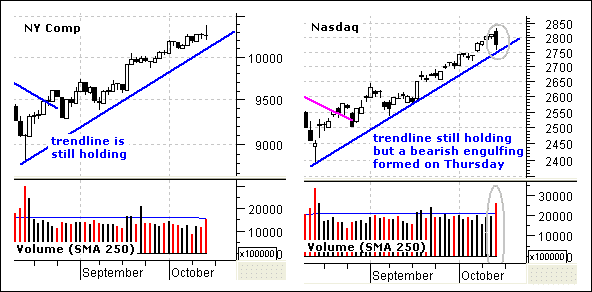
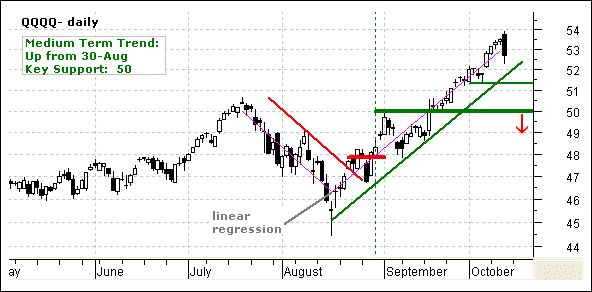
QQQQ formed a big bearish engulfing on Thursday, but the overall trend remains up. One day is usually not enough to reverse the medium-term uptrend and QQQQ remains above the August trendline and the 5-Oct gap. Let's wait for a break below the August trendline and the 5-Oct gap before even considering a trend change.
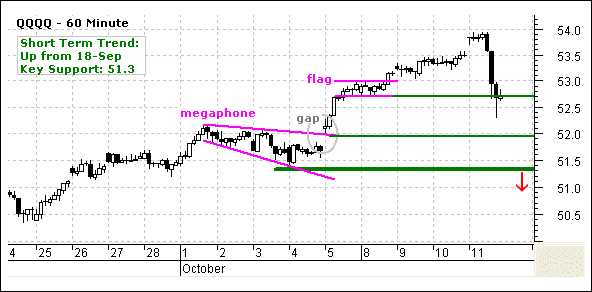
On the 60-minute chart, QQQQ opened strong and closed weak. The ETF ended the day near support from the flag low. The flag breakout failed to hold and this is the first negative in the last few weeks. I still see a big support zone around 52 (plus or minus fifty cents) and the decline could extend into this area. Support here stems from the 5-Oct gap, the megaphone breakout and the 4-Oct lows.
Position: No current position.
***S&P 500 ETF (SPY)***
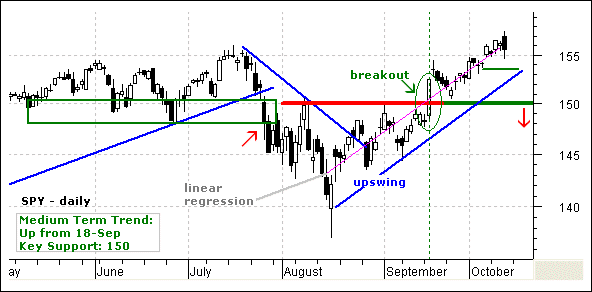
SPY broke above its July high with gap and then formed a bearish engulfing pattern yesterday. Even though the breakout is still holding and the overall trend remains up, I still find the ETF overbought and vulnerable to further consolidation or even a correction. The magenta trendline is the linear regression for this rally and the blue parallel trendline defines this upswing. There is no sense considering a medium-term trend reversal as long as this trendline holds. Declines above this trendline are deemed pullbacks. Key support remains at 150 and stems from broken resistance.
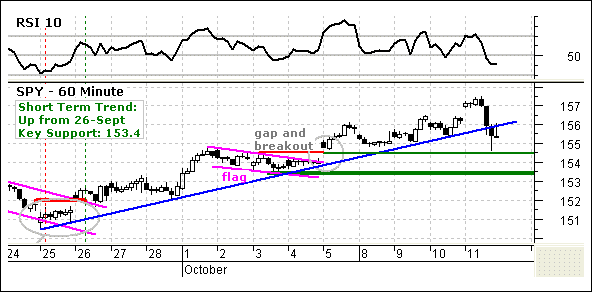
On the 60-minute chart, SPY broke the 25-Sep trendline with a sharp decline on Thursday. The trendline break is negative, but the overall trend remains up. The ETF still has higher highs and higher lows working over the last 2-3 weeks. Broken resistance around 154.5 marks the first support level and key support remains at 153.4. RSI moved below 50 and this is short-term negative. However, I am using this indicator to identify a potential buying point. RSI will start entering short-term oversold territory in the lows 30s and this may present a low risk entry point. RSI is currently 41 and this suggest a little more correction is needed.
Position: No current position.
***Russell 2000 iShares (IWM)***
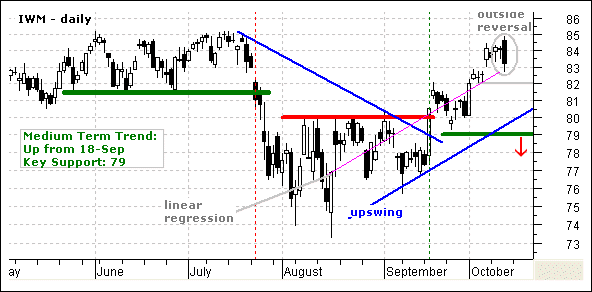
IWM reached its July high and then formed an outside reversal. The ETF opened above 84.5 and closed below the lows of the last three days. The black candlestick engulfed the prior three and this is short-term negative. The medium-term uptrend is not affected through. The magenta trendline shows the linear regression and the blue parallel trendline defines the current upswing. Key support remains at 79 and a break below this level would reverse the medium-term uptrend.
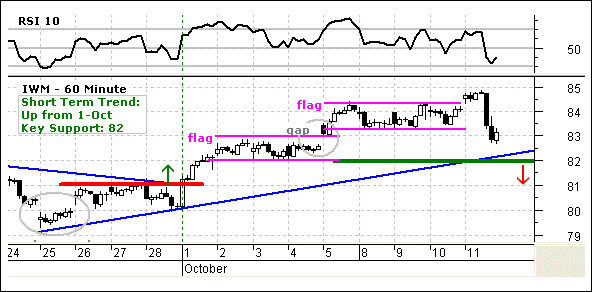
On the 60-minute chart, IWM failed to hold the flag breakout and broke below the flag low. This is quite negative, but there is still a lot of support around 82-83 from the first flag. In addition, the 25-Sept trendline marks support in this area. The ETF got hit hard and there could be some downside follow trough and a test around 82. While break below 82 would technically reverse the short-term uptrend, I would not sell short because the medium-term trend remains up. Instead, I would look for buying opps around this level and when 10-period RSI moves below 30 (oversold).
Position: Long from 81.1 on 28-Sep. 1/2 closed at 83.91 on 8-Oct. I am going to heed the warning from yesterday and close the rest of this position.
Good day and good trading -Arthur Hill
---------------------------------------------------------------
Click here to post a comment, suggestion or question.
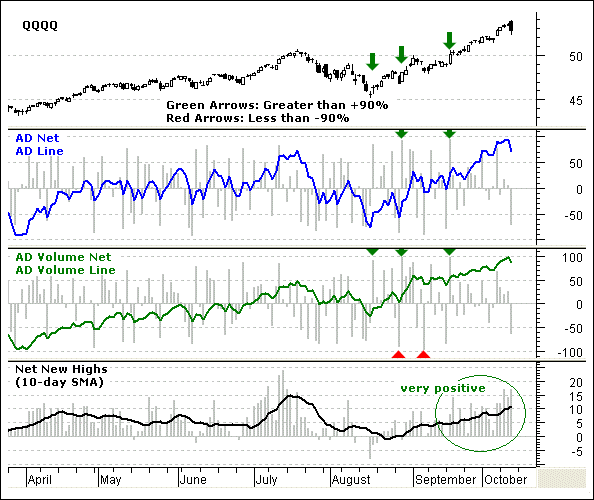
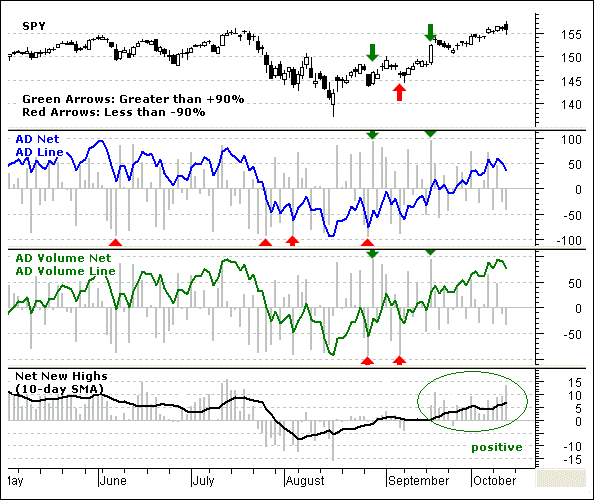
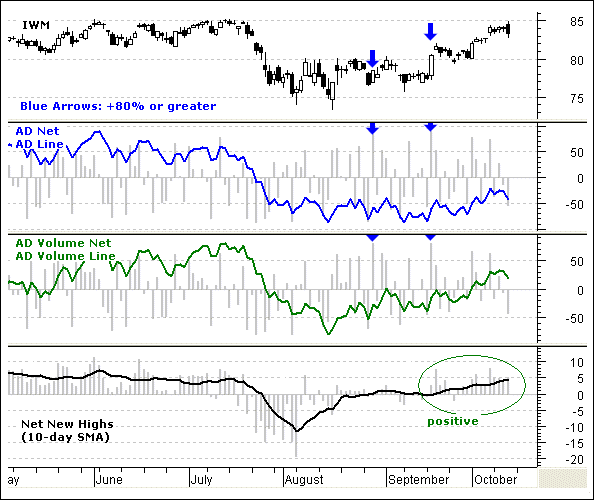
Breadth Charts ---------------------------------
---------------------------------------------------------------
Disclaimer: Arthur Hill is not a registered investment advisor. The analysis presented is not a solicitation to buy, avoid, sell or sell short any security. Anyone using this analysis does so at his or her own risk. Arthur Hill and TD Trader assume no liability for the use of this analysis. There is no guarantee that the facts are accurate or that the analysis presented will be correct. Past performance does not guarantee future performance. Arthur Hill may have positions in the securities analyzed and these may have been taken before or after the analysis was present.
--------------------------------------------------------
about: The Daily Swing is posted every trading day around 6AM ET and focuses on short-term strategies for QQQQ, SPY and IWM. In addition, at two stock setups are featured every day with a detailed trading strategy. As warranted, coverage extends to broad market topics, key sectors and industry groups and inter-market securities (gold, bonds, the Dollar and oil).
--------------------------------------------------------
Sources: Data from Bloomberg.com, CBOT.com, Kitco.com and ino.com; Charting from Metastock (equis.com). Closing data from Reuters.com, eSignal.com, MS QuoteCenter and Yahoo! Finance.


