Edited by NAV, 16 October 2007 - 10:30 PM.

Reading it like it is....
Started by
NAV
, Oct 16 2007 10:27 PM
7 replies to this topic
#1

NAV
-
- Traders-Talk User
- 16,087 posts
Member
Posted 16 October 2007 - 10:27 PM
My hourly indicators on ES and YM remains in a sell territory, INTC report notwithstanding. NQ hourly is on a buy though. So if we don't see a recovery on the ES above 1562 in the overnight session, odds are very high that they will sell the news i.e sell NQ tommorow. If ES gaps up above 1562, i will turn bullish and start buying the dips. YM closed below 14022 horizontal channel (that i have been posting here the last few days), on a daily closing basis, which is not good technically. So it is now clear that we have a breakout failure here out of the channel, which targets the 9/25 lows. There's a time to be bullish and there's a time to be bearish. Permas (bulls or bears) lose, period ! We need to get back into the channel on a daily closing basis at a minimum to get bullish on a daily chart basis.
Yesterday i played the dark side and today again i am planning to play the dark side(as long as we stay below ES 1562 level). Good luck....
#2
dcengr
-

- Traders-Talk User
- 13,391 posts
Member
Posted 16 October 2007 - 10:41 PM
The market is sending a very strong message:
If it can't go up during the day, they'll make it go up during the night.
Now if it would just gap up after hours more than the decline during normal hours, the uptrend would be intact.
I dunno about the US markets, but I have this very overwelming urge to short chinese stocks... I dunno why. Its like a little voice in my head whispering "shorting opportunity of the decade".. but its only a feeling. I guess I'll short like $100 just so I can make the whispers stop.
Qui custodiet ipsos custodes?
#4
NAV
-
- Traders-Talk User
- 16,087 posts
Member
Posted 16 October 2007 - 11:32 PM
ES also broke the channel, that i referred to, a few days ago (on a daily closing basis). This is also ST bearish.
#5
eminimee
-

- TT Member
- 14,307 posts
I don't care who's fur is flying...
Posted 17 October 2007 - 05:29 AM
http://stockcharts.com/c-sc/sc?s=$TRAN&p=D&yr=2&mn=6&dy=0&i=p18733341429&a=92067993&r=3254.png
http://stockcharts.com/c-sc/sc?s=$BKX&p=60&yr=1&mn=0&dy=3&i=p56956432260&a=89765548&r=9157.png
http://stockcharts.com/c-sc/sc?s=$XBD&p=60&yr=0&mn=6&dy=3&i=p97263688854&a=102368544&r=6742.png
http://stockcharts.c...8804&r=7626.png
http://stockcharts.com/c-sc/sc?s=$BKX&p=60&yr=1&mn=0&dy=3&i=p56956432260&a=89765548&r=9157.png
http://stockcharts.com/c-sc/sc?s=$XBD&p=60&yr=0&mn=6&dy=3&i=p97263688854&a=102368544&r=6742.png
http://stockcharts.c...8804&r=7626.png
#6
eminimee
-
- TT Member
- 14,307 posts
I don't care who's fur is flying...
Posted 17 October 2007 - 07:18 AM
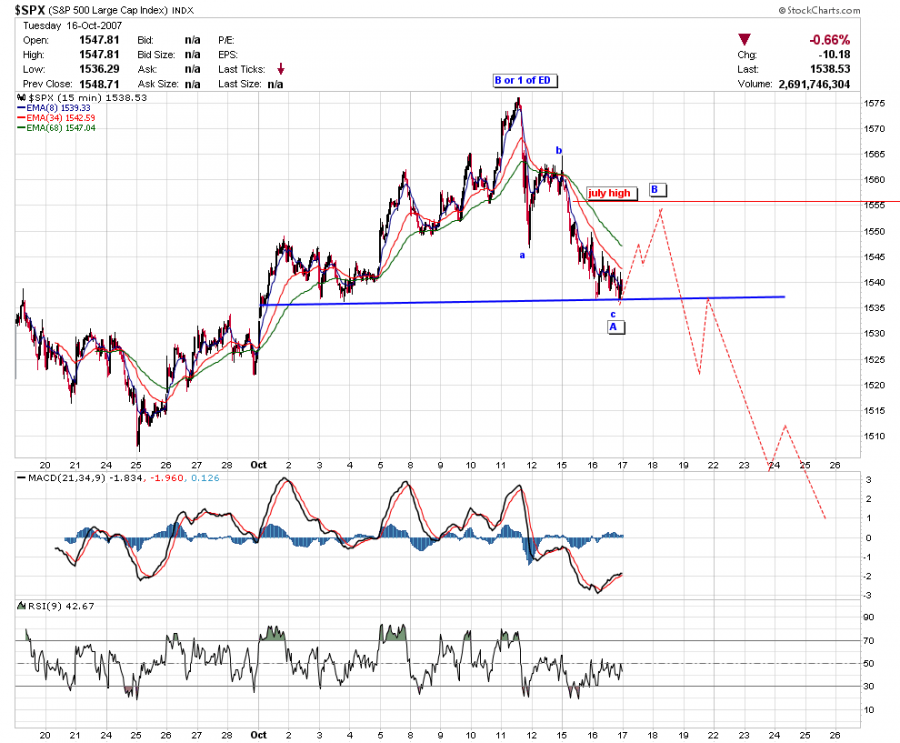
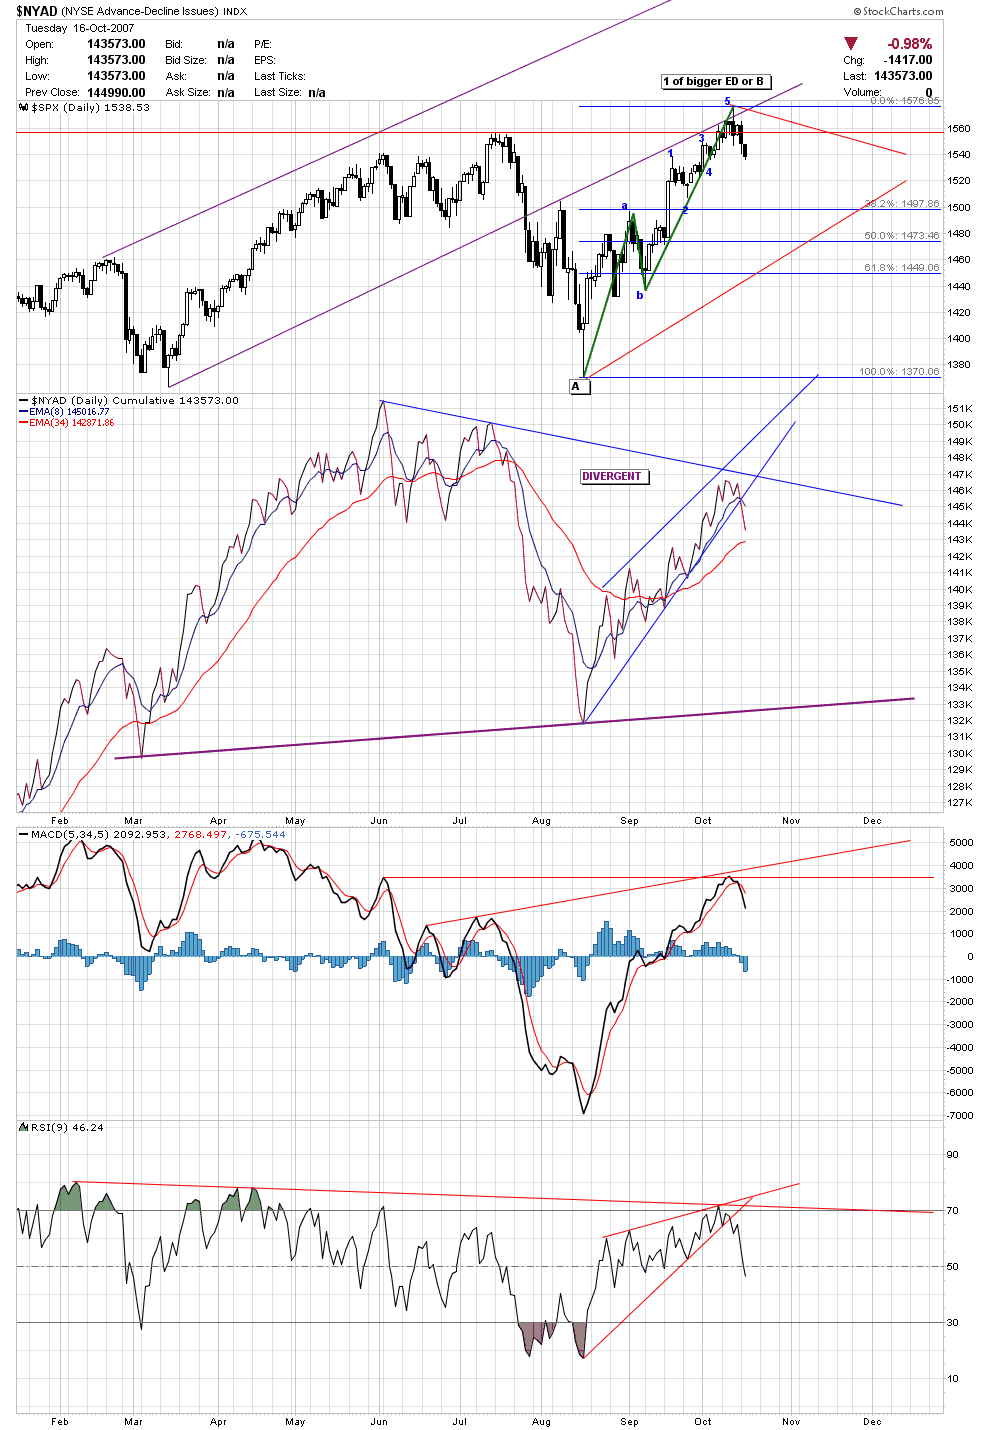
I know we have a few options here..but I have to say...personally I'm back to favouring either a B wave top is in place....or wave 1 of a bigger ED is in place on spx/oex. I've never seen two smaller ED's in a impulse move before but maybe others have.....wave 1 ended in an ED and now wave 3 (of lesser degree) has ended in an ED....suspicious??
Anyways....here's a few charts that are pushing me to B or wave 1 high being in. Keeping in mind that if we did top a B wave....it does open the doors to new lows or could be a C in a bigger triangle......a wave 2 of an ED most likely down to a fib level. One other point...a key number is going to be 720 area on OEX...the mid july peak.
First the count that I see that is possible here.
 Possible from the top
....and if by chance this is a real possibility....measured move is 1488 ish....
Possible from the top
....and if by chance this is a real possibility....measured move is 1488 ish....
 Possible from the top
....and if by chance this is a real possibility....measured move is 1488 ish....
Possible from the top
....and if by chance this is a real possibility....measured move is 1488 ish....

#7
NAV
-
- Traders-Talk User
- 16,087 posts
Member
Posted 17 October 2007 - 07:22 AM
I've never seen two smaller ED's in a impulse move before but maybe others have.....
Not possible. EDs are by definition terminal waves and cannot be part of an impulse sequence.
#8
eminimee
-
- TT Member
- 14,307 posts
I don't care who's fur is flying...
Posted 17 October 2007 - 07:45 AM
that's my point...and why I'm having a tough time seeing the move from the aug . low impulsive.....even though it's been one hell of a run......but B waves can do that.
Edited by Teaparty, 17 October 2007 - 07:47 AM.


