
***Position Summary***
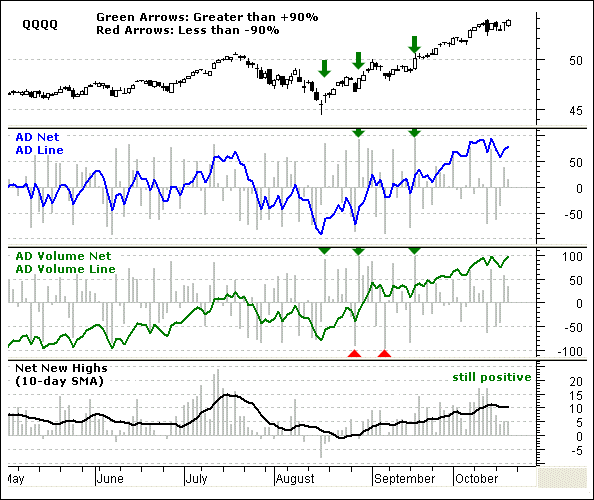
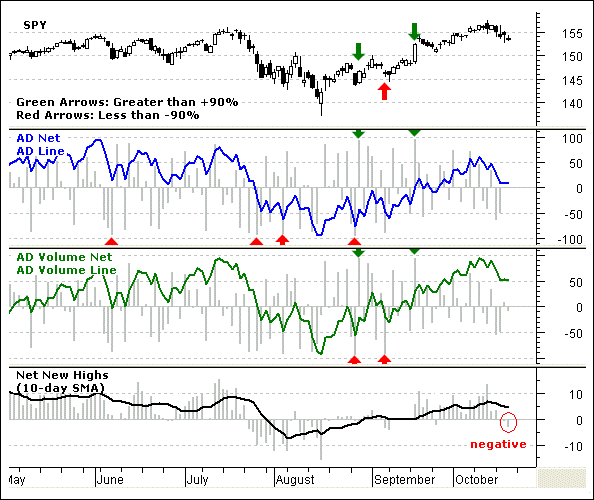
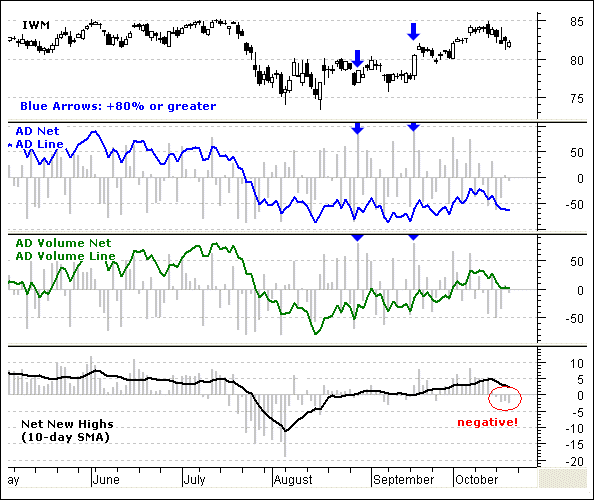
The market was mixed again yesterday. SPY and DIA edged lower, while IWM and QQQQ edged higher. Once again, the Finance SPDR (XLF) and Consumer Discretionary SPDR (XLY) were the weakest sectors and this is not a good sign for the market as a whole. QQQQ stalled the last five days and is currently trading near the top of its range. SPY and IWM corrected over the last five days and remain in short-term downtrends. This market is clearly not firing on all cylinders and there are big pockets of weakness. In addition, Net New Highs were negative for SPY and IWM yesterday as new lows expanded again yesterday. You can view these breadth charts at the end of this commentary. The futures are pointing to a gap down on the open and we should watch what happens after the gap. Failure to rebound after the gap would be quite negative.
Today's commentary is broken into three sections. Short-term analysis for IWM, QQQQ and SPY is presented below and the Stock Setups Portfolio has been updated. Later today (around 9AM), I will post another commentary looking at the long-term picture, breadth, the inter-market area and select ETFs.
The stock setups page is updated on Tuesdays and Fridays. ***Click here***
***Nasdaq 100 ETF (QQQQ)***
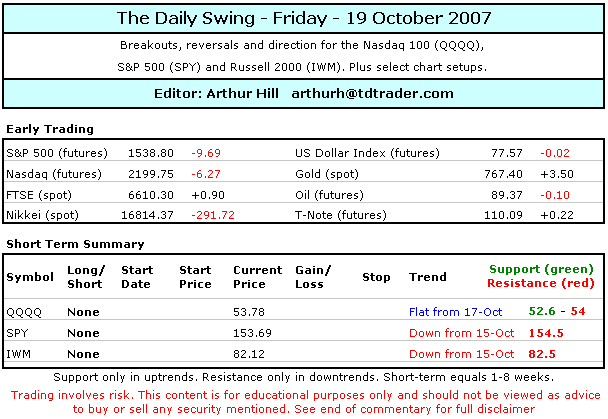
The overall trend remains up for QQQQ and minor support at 52 is the first level to watch for signs of weakness. The ETF formed a big bearish engulfing on 11-Oct and then FIVE inside days. This means that trading the last five days has been within 11-Oct high-low range and this amounts to a consolidation. A break from this consolidation will provide the next signal. Watch 54 up and 52 down.
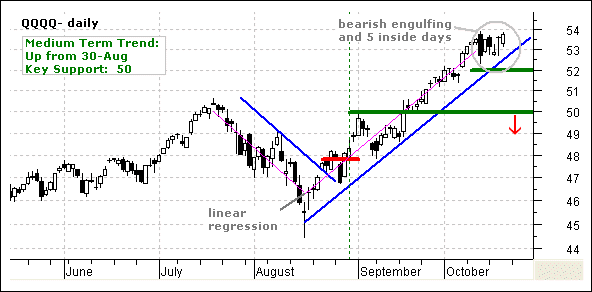
On the 60-minute chart, the bearish engulfing and four inside days formed a triangle and QQQQ broke above the upper triangle trendline yesterday. Despite this break, the ETF stalled in the afternoon and there is still a lot of resistance around 53.8-54. The magenta trendlines within the triangle capture the swings and the current swing is up. A move below the magenta trendline and minor support at 53.1 would be the first signal and a break below key support at 52.6 would start a downtrend. While the risk-reward ratio for new shorts is quite good at current levels, QQQQ and techs remain relatively strong and trading remains quite volatile.
Position: No current position. The short-term trend is flat at the ETF remains locked in a trading range the last five days.
***S&P 500 ETF (SPY)***
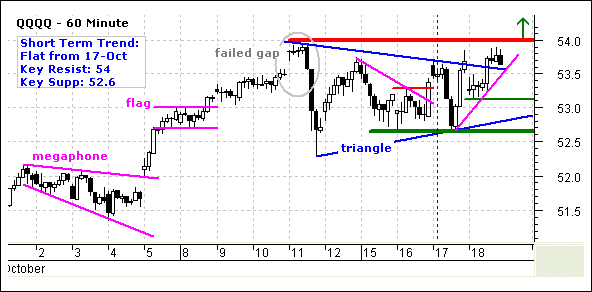
SPY remains in a clear uptrend on the daily chart with key support at 150. The ETF broke its July high and then pulled back over the last six days. Prior corrections or pullbacks lasted 2-4 days and this is the most weakness since early August. The ETF is trading near trendline support and this correction is entering a make-or-break point.
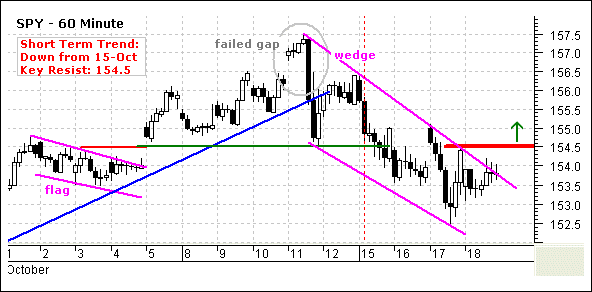
On the 60-minute chart, the six day correction looks like a falling wedge and these patterns are typical for pullbacks within uptrends. The wedge is still falling though and we need to wait for a breakout before considering the correction finished. The ETF consolidated yesterday and I am lowering key resistance to 154.5. A move above this level would break the wedge trendline and exceed the Wednesday afternoon high. This would reverse the downtrend and call for a continuation of the larger uptrend. I would then set key support at 152.5.
Position: No current position. SPY broke below support at 155.5 on 15-Oct and to start a short-term downtrend.
***Russell 2000 iShares (IWM)***
The overall trend for IWM remains up with key support at 79. As with SPY and QQQQ, I drew a linear regression first (magenta trendline) and then a parallel trendline off the lows (blue). The upswing line defines the medium-term uptrend and rate of ascent. A close below this trendline would be quite negative. There is a lot of support around 80-81 from the upswing line and broken resistance. This is the first area to look for firmness and a potential reversal.
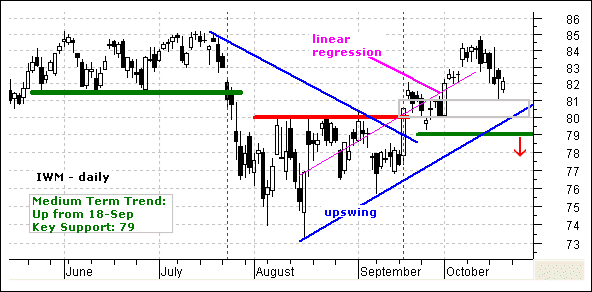
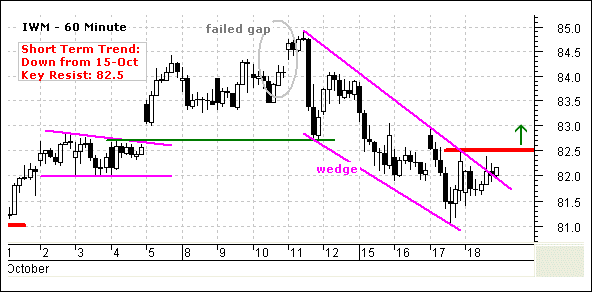
The 60-minute chart captures the six day decline and correction. A falling wedge evolved and the ETF edged above the upper trendline yesterday. I am lowering key resistance at 82.5 and a break above this level would reverse the short-term downtrend. This would call for a continuation of the medium-term uptrend and we could then see a rally back towards the October high. Wait for the breakout.
Position: No current position. IWM broke below support at 83.4 on 15-Oct and to start a short-term downtrend.
Good day and good trading -Arthur Hill
---------------------------------------------------------------
Click here to post a comment, suggestion or question.
Breadth Charts ---------------------------------
---------------------------------------------------------------
Disclaimer: Arthur Hill is not a registered investment advisor.
The analysis presented is not a solicitation to buy, avoid, sell or sell short any security. Anyone using this analysis does so at his or her own risk. Arthur Hill and TD Trader assume no liability for the use of this analysis. There is no guarantee that the facts are accurate or that the analysis presented will be correct. Past performance does not guarantee future performance. Arthur Hill may have positions in the securities analyzed and these may have been taken before or after the analysis was present.
--------------------------------------------------------
about: The Daily Swing is posted every trading day around 6AM ET and focuses on short-term strategies for QQQQ, SPY and IWM. In addition, at two stock setups are featured every day with a detailed trading strategy. As warranted, coverage extends to broad market topics, key sectors and industry groups and inter-market securities (gold, bonds, the Dollar and oil).
--------------------------------------------------------
Sources: Data from Bloomberg.com, CBOT.com, Kitco.com and ino.com; Charting from Metastock (equis.com). Closing data from Reuters.com, eSignal.com, MS QuoteCenter and Yahoo! Finance.


