But that's a rumor.
The facts are:
1. We have a financial crisis based on banks
2. Bank stocks are plummetting
3. NDX stocks are skyrocketting
4. Fed has cut rates twice
5. II polls are bullish
6. Overall NYSE short interest is high
If you look at the charts, the pattern is very similar to that of 1998. In other words, after the Fed cut, the markets took off in a straight line. When the Dow/S&P reached near their pre-correction values, it stalled and the banks started to lead it down again. The NDX barely budged.
Breadthwise, same thing. On the rise, breadth was pretty pissy, for both Nasdaq and NYSE. I could post some charts, but I think many have the resources to see that what I'm saying is true.
Sentiment was high but prices never came down. And short interest was sky high.
The above state the similarities, but there are, ofcourse, differences.
1. 1998 was in the midst of an economic boom started by the internet revolution. The economic catalyst for this bull market was housing, not techs. Hence a correction in the financials did not affect the tech bull market. The economy was fed by techs (ie workers hired by tech companies made money and spent it on techs). Workers now are fed by housing, and now that money is gone, they don't have the money to spend it on techs. However, I do admit that we are on the virge of another technology cycle involving LCD/HD TVs, wireless revolution, etc. BUT realize that big bad boys of hedgefunds, PTJ and Steve Cohen, have dumped their big broadband/media stocks (cable, etc)
2. Chips (semis) and Internet A-D line was strong and advancing during 1998 post correction. They are not this time around.
3. USD had bottomed and was rising with the market, it hasn't bottomed yet and still appear to be in freefall. However, I do think USD will bounce shortly.
4. Commodity prices were rock bottom, and oil was no where near its highs
5. Back in 1998, we had the asian financial crisis, and they didn't recover for a while. Today, we have a US financial crisis, and asian countries/markets haven't been affected much (except Japan).
I'm not saying another tech bubble or a minor version of that can't appear. I do think some believe its 1998 because of these similarities, and time will tell whether its a repeat of 1998 or something else. But a discussion on this topic is probably worthwhile pursuing.

Is it 1998?
Started by
dcengr
, Nov 03 2007 02:08 PM
9 replies to this topic
#1

dcengr
-
- Traders-Talk User
- 13,391 posts
Member
Posted 03 November 2007 - 02:08 PM
Qui custodiet ipsos custodes?
#2
Trend-Signals
-

- Traders-Talk User
- 1,136 posts
Member
Posted 03 November 2007 - 02:18 PM
Is this your writing or someone else's? 
#3
dcengr
-
- Traders-Talk User
- 13,391 posts
Member
Posted 03 November 2007 - 02:30 PM
This is all my writing. Do I normally sound like an idiot that can't put something like this together or vice versa?  Seriously, I've put a lot of hours thinking about whether its 1998 or not. My end conclusion is that its not, although there are many technical similarities. The one that counts the most, however, is price. And price pattern right now is saying NDX up, SPX down. Very close pattern wise to 1998.
1937 has much more correlation on many levels than 1998. Unfortunately, there was no NDX back then, so its hard to imagine how the techs would have fared.
I can post some more charts of 1998 (futures positions, breadth data, sentiment, etc) if people are interested. At the moment, however, I'm doing a study on parabolics and how to predict their termination. I'll likely open a thread on that later this weekend after a few runs.
Seriously, I've put a lot of hours thinking about whether its 1998 or not. My end conclusion is that its not, although there are many technical similarities. The one that counts the most, however, is price. And price pattern right now is saying NDX up, SPX down. Very close pattern wise to 1998.
1937 has much more correlation on many levels than 1998. Unfortunately, there was no NDX back then, so its hard to imagine how the techs would have fared.
I can post some more charts of 1998 (futures positions, breadth data, sentiment, etc) if people are interested. At the moment, however, I'm doing a study on parabolics and how to predict their termination. I'll likely open a thread on that later this weekend after a few runs.
Qui custodiet ipsos custodes?
#4
Trend-Signals
-
- Traders-Talk User
- 1,136 posts
Member
Posted 03 November 2007 - 02:42 PM
Well, written, thanks
The reason that I asked is that you mentioned someone's initials.
" Is it 1998?, I've heard rumors PTJ thinks so"
~~
I mentioned "1997-1998" as a part of my market analysis since the focus began on 8/16 based on VIX signal, and have followed up on the subject.
Since we are living in evolved economically and geopolitically, I do not think that all factors in fractal formation will play out exactly the same.
Your list of correlating factors between the two period, i.e. 1998 and 2007, is well written.
It seems that many are looking for 11/2 - 12/20 +/-, which I noted as a cycle with 11/2 +/- as pivotal date, as down-side.
This suggests that market has formed LT top since I do not think that there will not be a fresh rally starting from Jan 2008.
As noted earlier, my position is the recent trend-continuation, not as trend-reversal until market proves otherwise.
Will see and thanks
#5
ed rader
-

- Traders-Talk User
- 2,390 posts
Member
Posted 03 November 2007 - 02:53 PM
This is all my writing. Do I normally sound like an idiot that can't put something like this together or vice versa?
Seriously, I've put a lot of hours thinking about whether its 1998 or not. My end conclusion is that its not, although there are many technical similarities. The one that counts the most, however, is price. And price pattern right now is saying NDX up, SPX down. Very close pattern wise to 1998.
1937 has much more correlation on many levels than 1998. Unfortunately, there was no NDX back then, so its hard to imagine how the techs would have fared.
I can post some more charts of 1998 (futures positions, breadth data, sentiment, etc) if people are interested. At the moment, however, I'm doing a study on parabolics and how to predict their termination. I'll likely open a thread on that later this weekend after a few runs.
that's the 64k question and i've thought alot about it too. public sentiment is completely different. people are pessimistic in general.
i just talked to a friend for over an hour and he's usually very bullish on business but he says for once in his lifetime he's pessimistic and it's causing him to question everything including his age
 . also this guy has very key positions in several tech companies.
me, well i turned bearish in 98....which in hindsight was a mistake tho it probably spared me somewhat later. and i am bearish now tho heavily invested.
i tend to think we're closer to 2000 than 98.
ed rader
#6
SemiBizz
-

- Traders-Talk User
- 23,208 posts
Volume Dynamics Specialist
Posted 03 November 2007 - 04:29 PM
The Man Who Won as Others Lost
Mr. Prechter, who keeps in touch with Mr. Jones through e-mail and the occasional phone call, says that Mr. Jones, his recent rough stretch notwithstanding, is best placed to survive a crash."He does not go cold and clammy," Mr. Prechter said.
He does not know if Mr. Jones shares his dark view of the market, though he allows that "Paul is certainly aware of the risk of an extensive bear market" and "is well aware that stocks are vulnerable."
But don't expect Mr. Jones to relive his 1987 glory. One investor who has spoken with him in the last week, who asked not to be identified because he is not authorized to speak publicly about Mr. Jones's investment strategies, said that the recent rate cut had made Mr. Jones increasingly bullish. Indeed, as opposed to 1987, Mr. Jones is said to be reminded of 1998, when cuts by the Federal Reserve led to the stock market boom of the late 1990s. "I have not heard him mention Prechter in a long time," this investor said.
Edited by SemiBizz, 03 November 2007 - 04:29 PM.
Price and Volume Forensics Specialist
Richard Wyckoff - "Whenever you find hope or fear warping judgment, close out your position"
Volume is the only vote that matters... the ultimate sentiment poll.
http://twitter.com/VolumeDynamics http://parler.com/Volumedynamics
Richard Wyckoff - "Whenever you find hope or fear warping judgment, close out your position"
Volume is the only vote that matters... the ultimate sentiment poll.
http://twitter.com/VolumeDynamics http://parler.com/Volumedynamics
#7
Pabst
-

- Traders-Talk User
- 293 posts
Member
Posted 03 November 2007 - 05:17 PM
Another big diff: In 1998 the paper that LTCM held was of much higher quality than the near worthless crap on the books today. Heck much of LTCM's portfolio was Treasuries.
In '98 the risk to money center banks was counter party solvency. Today the risk is stuff those same banks actually own.
In '98 the risk to money center banks was counter party solvency. Today the risk is stuff those same banks actually own.
Free market's for free men!
#8
dcengr
-
- Traders-Talk User
- 13,391 posts
Member
Posted 03 November 2007 - 08:24 PM
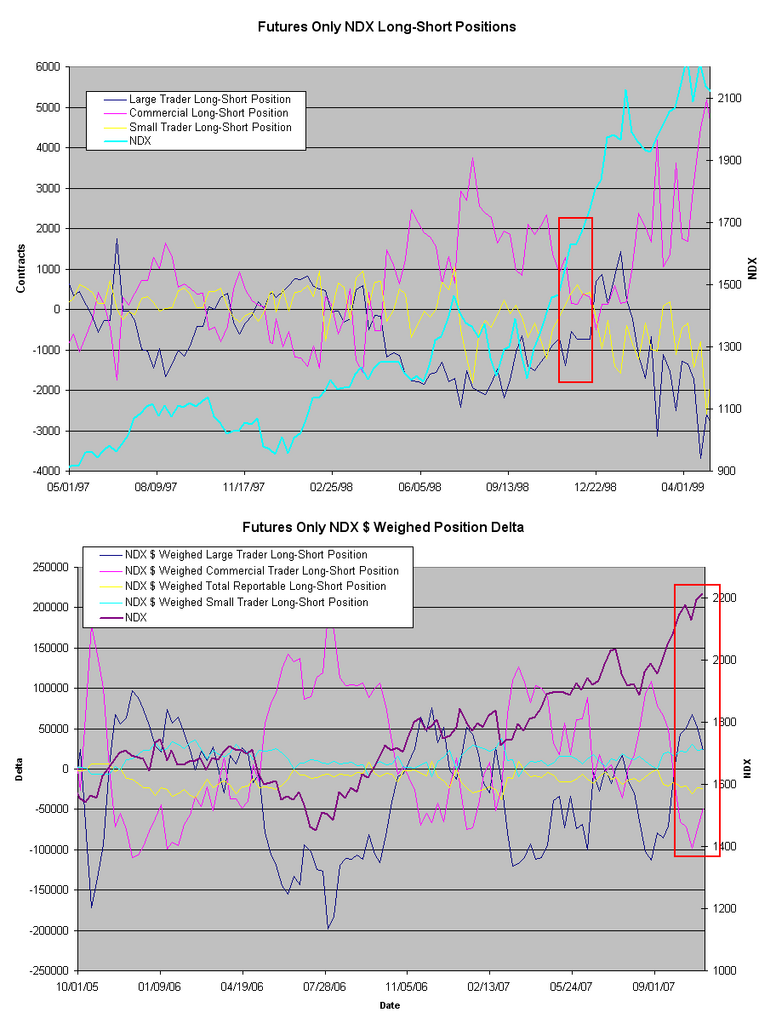
This is what the futures looked like in 1998 vs 2007.
I've boxed the similar area in 1998 where we should be, according to price pattern (and time from bottom).
But as you can see, commercials were very long back then, and large traders were short and ramping up. Small fries were very long and just turning short.
In 2007, commercials are short, large traders long, and small fries are still long...
Qui custodiet ipsos custodes?
#9
Pabst
-
- Traders-Talk User
- 293 posts
Member
Posted 03 November 2007 - 09:38 PM
This is what the futures looked like in 1998 vs 2007.
I've boxed the similar area in 1998 where we should be, according to price pattern (and time from bottom).
But as you can see, commercials were very long back then, and large traders were short and ramping up. Small fries were very long and just turning short.
In 2007, commercials are short, large traders long, and small fries are still long...
Don't be overly reliant on COT data for index (or any other financial) futures. COT is best used for physical commodities. Very few index "commercials" are "net" anything. If a firm is "short" NQ/ND you best believe they're long a basket of stocks or delta long in options or long RUT ect.
Free market's for free men!
#10
dcengr
-
- Traders-Talk User
- 13,391 posts
Member
Posted 03 November 2007 - 11:30 PM
This is what the futures looked like in 1998 vs 2007.
I've boxed the similar area in 1998 where we should be, according to price pattern (and time from bottom).
But as you can see, commercials were very long back then, and large traders were short and ramping up. Small fries were very long and just turning short.
In 2007, commercials are short, large traders long, and small fries are still long...
Don't be overly reliant on COT data for index (or any other financial) futures. COT is best used for physical commodities. Very few index "commercials" are "net" anything. If a firm is "short" NQ/ND you best believe they're long a basket of stocks or delta long in options or long RUT ect.
Yup, I'm a believer that only small traders are mostly directional (ie non-hedgers). Large and commercials are mostly hedgers.
I still haven't conclusively determined if the COT matters for anything stockwise.. the correlation seems tenuous at best.
Qui custodiet ipsos custodes?


