***Position Summary***
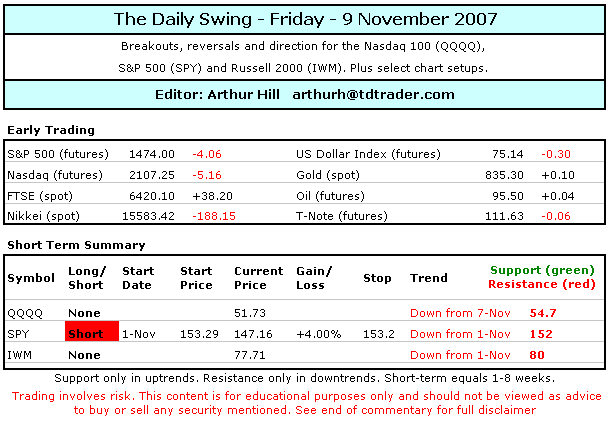
Those pesky late surges. Let's not read too much into yesterday's late surge and the potential high volume reversal day. More importantly, techs were down sharply and one of the few market leaders is suddenly looking vulnerable. QQQQ was the lone hold out and the ETF broke key support at 52 to start a medium-term downtrend. This means that IWM, QQQQ and SPY are all in medium-term downtrends now. All three are also in short-term downtrends. Yesterday's late surge was not enough to reverse these short-term downtrends and looks like an oversold bounce. The key, as always, is follow through. Let's see some strong follow through before taking a potential reversal day seriously.
This commentary focuses on IWM, QQQQ and SPY. I will post another commentary with some other observations around 8AM ET. The stock setups page is updated on Tuesdays and Fridays. ***Click here***
***Technical Highlights***
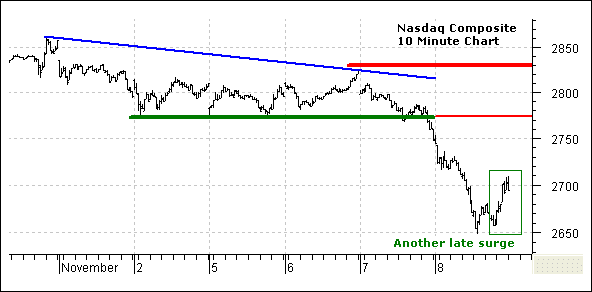
~Another Late Surge~ Stocks were sharply lower in early trading, but a late surge cut losses significantly and the market finished mixed. The Nasdaq 100 ETF (QQQQ) led the way down with a 3.04% loss. The Russell 2000 ETF (IWM) showed the best recovery with a .30% gain. NYSE and Nasdaq volume levels were the highest since August and many ETFs formed hammers yesterday. I will address the significance of hammers in the IWM daily chart analysis below. Breadth was mixed as advances outpaced declines in both SPY and IWM, but declines far outnumbered advances in QQQQ and the Nasdaq. Seven sectors were up with Utilities and Energy leading the way. The Consumer Discretionary and Technology sectors were lower. On the chart below, the Nasdaq was down around 100 points at 1:20PM, but surged 50 points to cut its losses in half. Nevertheless, the short-term damage was done with the support break and this break turns into resistance. I will explain the OIH chart in the QQQQ section.
***Nasdaq 100 ETF (QQQQ)***
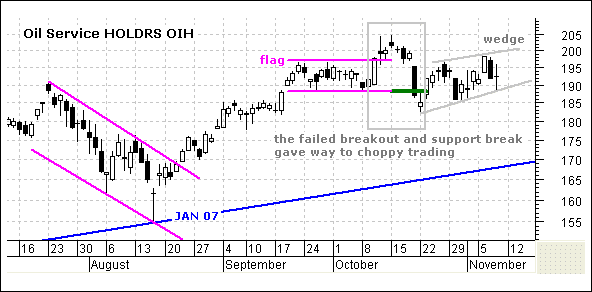
QQQQ broke flag resistance in late October, but this breakout failed to hold and the ETF plunged below key support at 52 yesterday. The failed breakout and support break are enough to reverse the medium-term uptrend. In addition, Net New Highs plunged to –12% and the AD Line broke below its October low. Breadth charts are at the bottom of this commentary. Even though I am now bearish, I would not be surprised to see choppy trading and perhaps even another surge back towards 54. Check out the Oil Service HOLDRS (OIH) chart from 21-Sept to 19-Oct. The flag breakout failed and OIH broke support with a sharp decline. This gave way to choppy trading the next three weeks. I think we could see something similar in QQQQ.
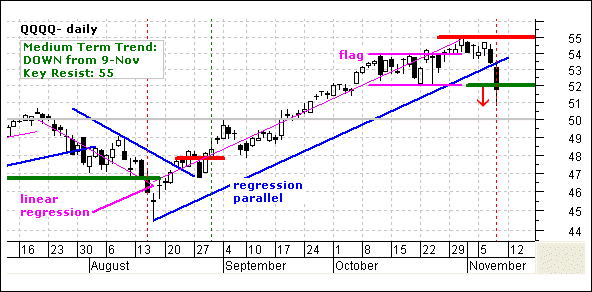
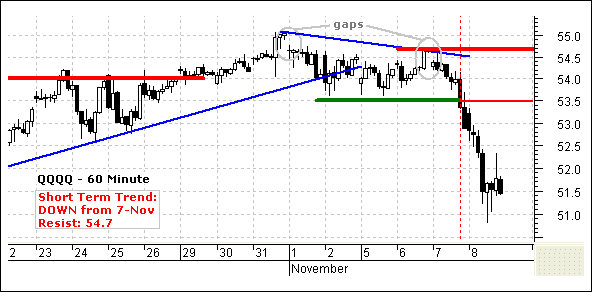
QQQQ broke support at 53.5 late Wednesday and continued lower on Thursday. The ETF found some support around 51 and consolidated the last few hours. Broken support at 53.5 turns into resistance and I am marking key resistance at 54.7. We could see an oversold bounce back into this region, but probably not until early next week.
Position: No current position.
Short-term Trend: Down from the 7-Nov support break at 53.5
***S&P 500 ETF (SPY)***
SPY now has a lower high at 155 and a lower low at 145. This is the basic definition of a downtrend (lower lows and lower highs). The decline looks like a falling price channel right now and SPY managed to firm at the lower trendline. There is also support around 1445 from the early September low and the five week decline retraced 62% of the Aug-Oct advance. Even though this is bottom picking territory, I am more concerned with the three –90% down days in the last three weeks and I am not comfortable picking a bottom just yet. As noted before, a significant bottom usually starts with a +90% up day.
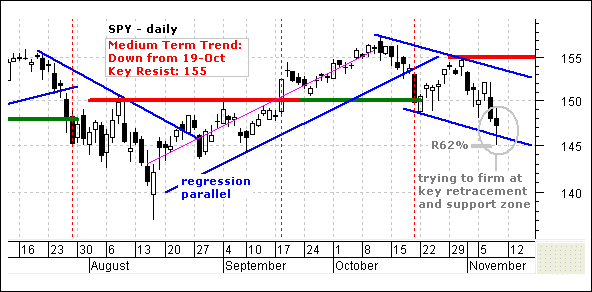
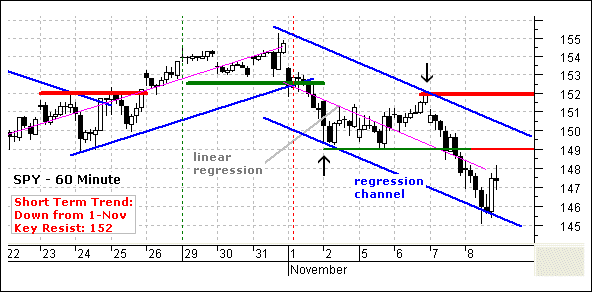
SPY remains in a short-term downtrend, but became oversold and bounced in late trading on Thursday. I first drew a linear regression (pink trendline) and this parallel trendlines from the reaction high and reaction low (black arrows). Even though the ETF bounced off the lower trendline, the overall trend is still clearly down. Broken support turns into resistance at 149 and key resistance remains at 152. Taken together, I am marking a resistance zone around 149-152 and would expect the first rally attempt to fail in this area, probably around 150.
Position: Short from 153.29 on 1-Nov. I am lowering my stop-loss to 152.2.
Short-term Trend: Down. SPY broke support at 152.5 and to start a short-term downtrend on 1-Nov (red dotted line).
***Russell 2000 iShares (IWM)***
The trend (down) and pattern (price channel) on IWM are similar to those on SPY. IWM formed a hammer yesterday and the ETF is finding some support around 76-77. The ETF also formed a bullish candlestick reversal (piercing pattern) on 22-Oct and this led to a seven day choppy advance. There was not much money to be made on that advance though. The hammer is potentially bullish, but within a clear downtrend and we need some strong confirmation (follow through). A surge and close above 80 on good volume and strong breadth would do the trick. Let's see it happen before getting excited.
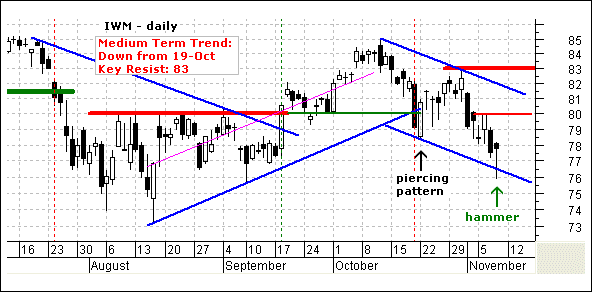
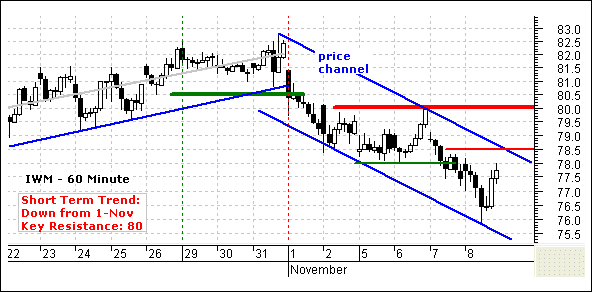
On the 60-minute chart, IWM hit the lower trendline of a falling price channel and bounced in the afternoon. This is just an oversold bounce for now. The trend is clear and the first resistance level at 78.5 stems from broken support. Key resistance remains at 80. Taken together, we have a resistance zone at 78-.5-80. I would expect an oversold bounce to fail in this area – probably around 79.
Position: No position.
Short-term Trend: Down. IWM broke support at 80.5 and to start a short-term downtrend on 1-Nov.
Good day and good trading -Arthur Hill
---------------------------------------------------------------
Click here to post a comment, suggestion or question.
Breadth Charts ---------------------------------
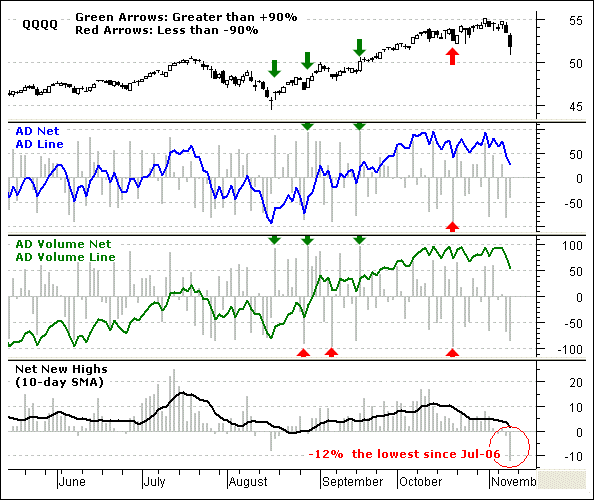
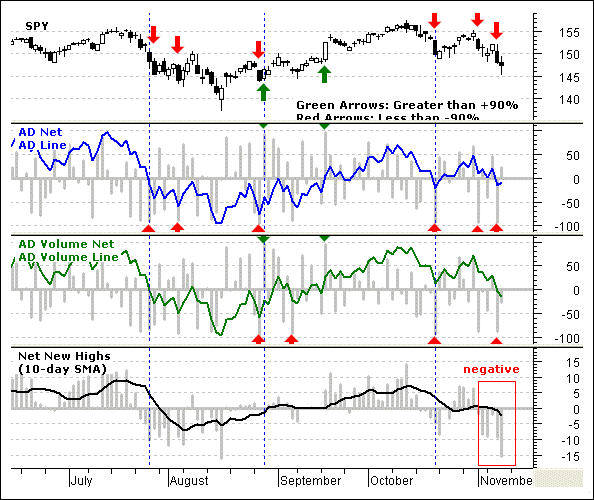
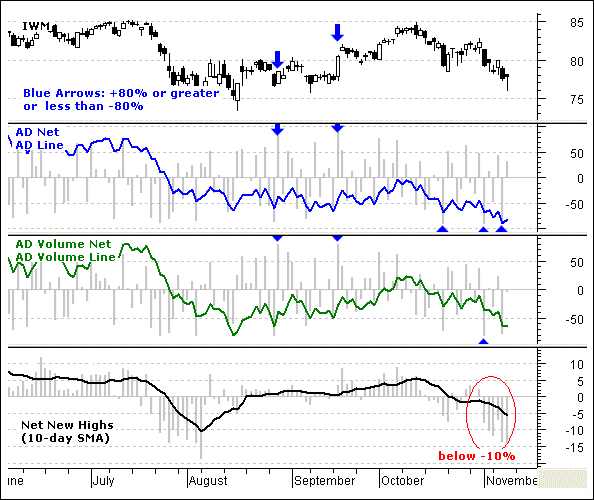
---------------------------------------------------------------
Disclaimer: Arthur Hill is not a registered investment advisor. The analysis presented is not a solicitation to buy, avoid, sell or sell short any security. Anyone using this analysis does so at his or her own risk. Arthur Hill and TD Trader assume no liability for the use of this analysis. There is no guarantee that the facts are accurate or that the analysis presented will be correct. Past performance does not guarantee future performance. Arthur Hill may have positions in the securities analyzed and these may have been taken before or after the analysis was present.
--------------------------------------------------------
about: The Daily Swing is posted every trading day around 6AM ET and focuses on short-term strategies for QQQQ, SPY and IWM. In addition, at two stock setups are featured every day with a detailed trading strategy. As warranted, coverage extends to broad market topics, key sectors and industry groups and inter-market securities (gold, bonds, the Dollar and oil).
--------------------------------------------------------
Sources: Data from Bloomberg.com, CBOT.com, Kitco.com and ino.com; Charting from Metastock (equis.com). Closing data from Reuters.com, eSignal.com, MS QuoteCenter and Yahoo! Finance.


