***Position Summary***
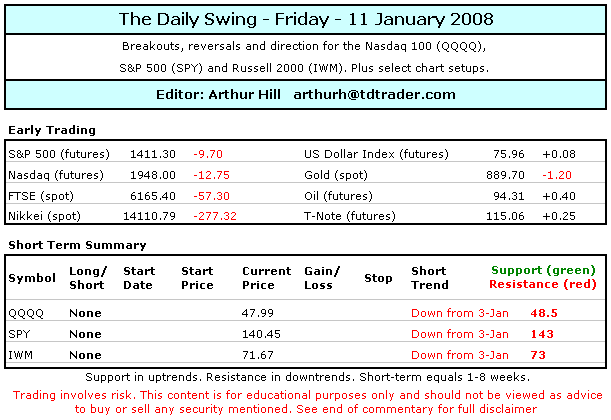
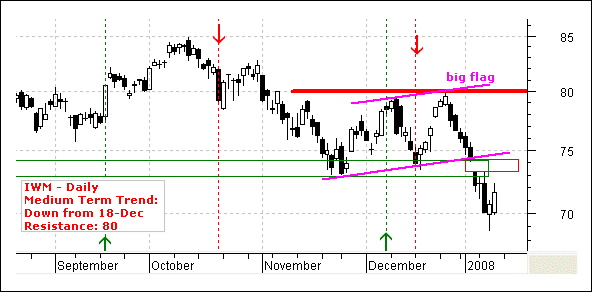
The major index ETFs became oversold on Tuesday and tried to bounce over the last two days. QQQQ and Techs led the way higher on Wednesday, while IWM and Finance led the way higher on Thursday. Breadth was not impressive on either day. In other words, the bounce was feeble with bad breadth in SPY, IWM and QQQQ – both Tuesday and Wednesday. Sustainable rallies start with strong breadth and this narrow bounce is not inspiring. The early bird gets the worm (bottom pickers), but the second mouse gets the cheese (hesitant traders). Personally, I find the major index ETFs too weak to justify longs, but also too oversold for new shorts. Given the choice, I would opt for a short position and trade with the current trends. The medium-term trends are down for IWM, QQQQ and SPY. With the bounce over the last two days, all three are trading close to short-term resistance levels. Given the weakness of the recent bounce, a failure is more likely than upside follow through.
This week's market moving events include:
- Friday: Earnings: Titan Machinery (TITN), Infosys (INFY)
- Monday: Earnings: Genentech (DNA)
- Tuesday: Retail Sales, PPI, Michigan Primary
- Earnings: Intel (INTC), State Street (STT), Citigroup © - Wednesday: CPI, Industrial Production, Beige Book
- Earnings: JP Morgan Chase (JPM), Well Fargo (WFC) - Thursday: Jobless Claims, Housing Starts
- Earnings: Shuffle Master (SHFL) - Friday: IBM (IBM), Xilinx (XLNX)
A Video Addition to today's commentary will be posted around 8AM ET - click here.
***Technical Highlights***
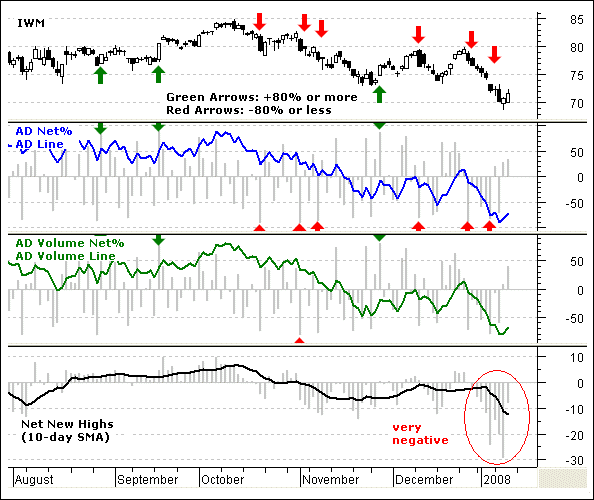
***Breadth Remains Bearish*** I would like to start out with some key breadth charts today. These include the AD Line, the AD Volume Line and Net New Highs for the S&P 1500. This is my preferred broad market index because it covers the S&P 500, the S&P 600 Smallcap and the S&P 400 Midcap Indices. The AD Line reflects small-cap performance, while the AD Volume Line reflects large-cap performance (volume leaders). The Net New Highs indicator is a lagging indicator that fits somewhere in between. All three confirm that the medium-term for the stock market is down.
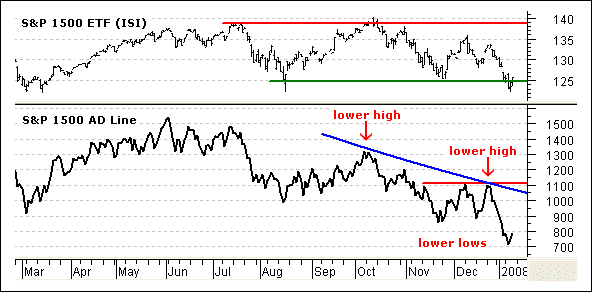
The AD Line confirms relative weakness in small-caps with lower highs in October and December. These were followed by lower lows in November and January. The overall trend is clearly down for the AD Line and a break above the December highs is needed to forge a reversal.
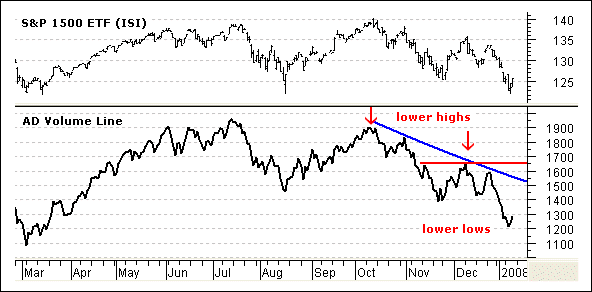
The AD Volume Line is in a clear downtrend after a breakdown over the last two months. The indicator almost equaled the July high in October, but fell short with a lower high. This was followed by a sharp decline and move below the August low. A clear downtrend is underway and the December high marks key resistance.
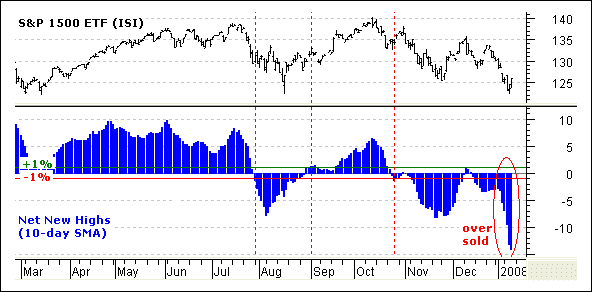
The 10-day SMA for Net New Highs moved below –10% for the first time since 2002. The decline over the last few months is clearly no ordinary decline. Moreover, 52-week lows expanded again in January and weakness spreading, not contracting. The line in the sand is +1% and the indicator remains bearish as long as it holds below this key level.
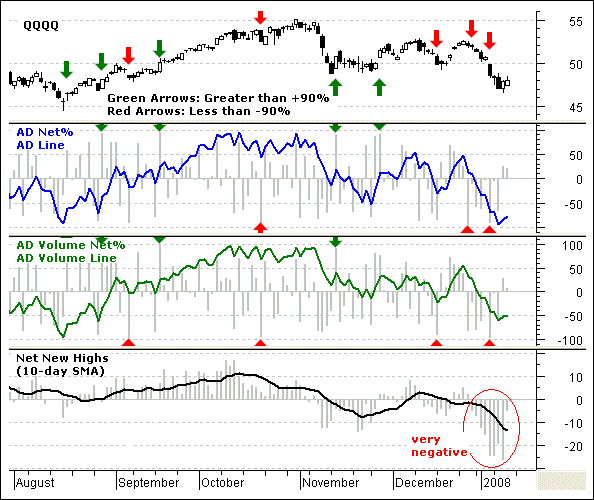
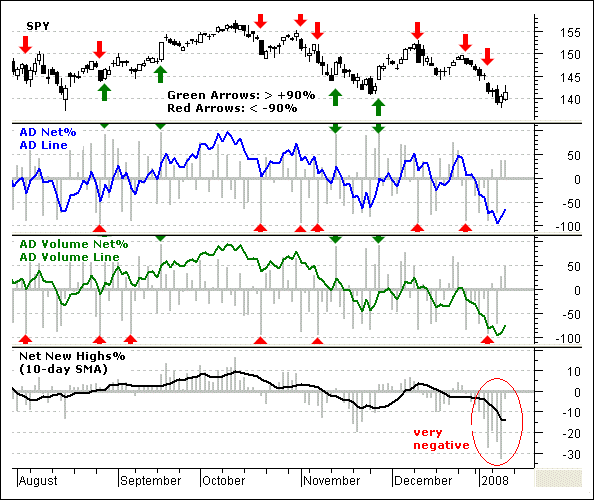
All three indicators are a bit oversold and this is the only positive to report. The Net New Highs indicator is especially oversold. We could see an oversold bounce, but that is all we can expect for now. I also watch AD Net% and AD Volume Net% for the S&P 500 ETF (SPY) and Nasdaq 100 ETF (QQQQ) on daily basis. Until we see a +90% up day in one or both of these indicators, the odds of a sustainable advance are quite low. The breadth charts at the bottom of this commentary show at least three –90% readings since 11-Dec. These have yet to be countered (reversed) with an equally strong bullish surge.
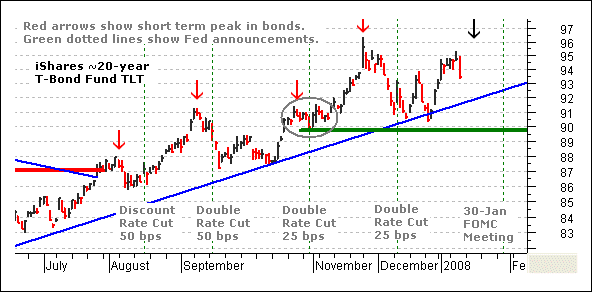
***TLT Peaking Ahead of Fed*** The iShares 20+ Year Bond ETF (TLT) remains in a clear uptrend, but is meeting resistance from its November high and could be peaking ahead of the Fed meeting. The red arrows show that TLT peaked or stalled ahead of the Fed cuts in July, September, October and November. Yesterday, Bernanke alluded to more cuts at the 30-January meeting, but TLT declined sharply. While I am not looking for a trend reversal in TLT, I would not be surprised to see some weakness heading into the Fed meeting. Key support remains at 90 and a close below this level would reverse the current uptrend.
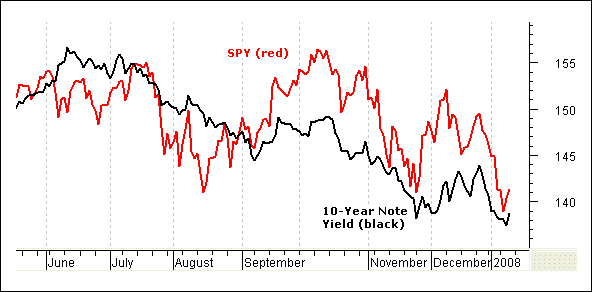
The second chart here shows the 10-Year Note Yield ($TNX) with the S&P 500 ETF (SPY). Yields peaked in June and declined steadily the last six months. SPY managed a higher high in October, but then fell to new lows in November and January. There are two messages here. First, falling rates are not helping the S&P 500 right now. Second, the stock market has been positively correlated to interest rates and negatively correlated to bonds. Should stocks decline further, I would expect bonds strengthen in a flight to safety.
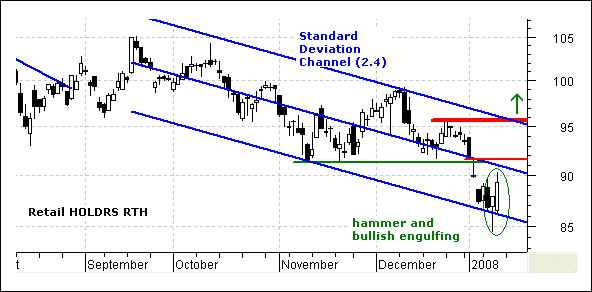
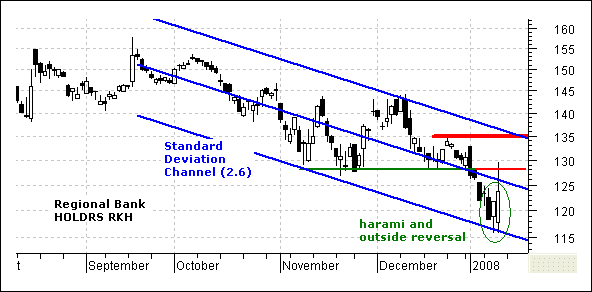
***RTH and RKH Firming*** Many stocks and ETFs are oversold and trying the firm. I pointed out some key tech ETFs and the Finance SPDR (XLF) yesterday. By extension, I would like to highlight two more ETFs that became oversold and are currently firming. The Regional Bank HOLDRS (RKH) represents a sub-group of the Finance sector, while the Retail HOLDRS (RTH) represents a sub-group of the Consumer Discretionary sector. These ETFs represent key groups that we should watch closely in the coming days.
The Retail HOLDRS (RTH) declined to the lower trendline of the Standard Deviation Channel (2.4 Standard Deviations) and firmed the last three days. A hammer formed on Wednesday and a bullish engulfing on Thursday. The overall trend is clearly down, but we could see an oversold bounce and move back towards resistance in the low 90s.
The Regional Bank HOLDRS (RKH) also declined to the lower trendline of the Standard Deviation Channel. The middle line is a linear regression and the outer lines are 2.6 Standard Deviations above/below. The ETF formed a harami on Tue-Wed and an outside reversal on Thursday. This shows support and we could see a bounce back to resistance around 130-135. As with RTH, I find RKH too oversold for new shorts, but too weak to justify longs or even bottom picking at this stage.
***Nasdaq 100 ETF (QQQQ)***
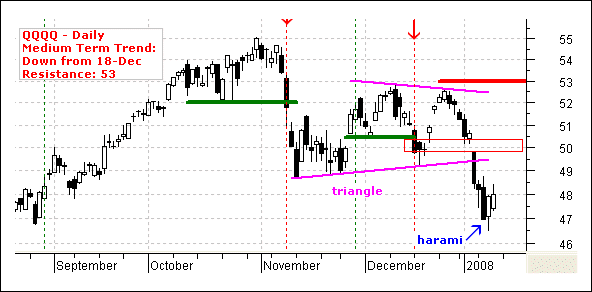
After breaking triangle support with a sharp decline the last two weeks, QQQQ has become oversold and ripe for a bounce or consolidation. The ETF showed signs of firmness with a harami on Tue-Wed and we could see a bounce towards 50. Resistance in this area stems from last week's gap and broken support.
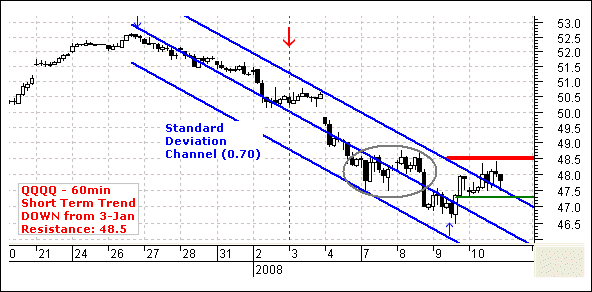
On the 60-minute chart, QQQQ broke above the Standard Deviation Channel, but stalled just below the prior consolidation (gray oval). The ETF is hitting resistance at 48.5 and I am lowering key resistance to this level. Basically, QQQQ surged late Wednesday and then stalled on Thursday. Look for a break above 48.5 to signal a continuation higher. The upside target would be the next resistance area around 50. As noted before, I am not interested in playing the first oversold bounce. Instead, I would first like to judge the internal strength or weakness of any bounce.
Short-term Trend: Down from 3-Jan (red arrow/line).
Position: No position.
***S&P 500 ETF (SPY)***
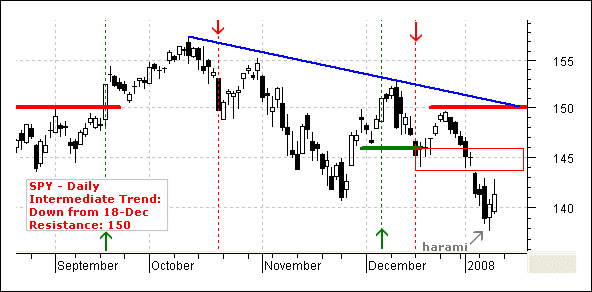
SPY became oversold and then firmed with a harami on Tue-Wed. It may seem as if the ETF is toying with the support zone from the November lows. However, SPY closed below its November low and forged a lower low. Even though a medium-term downtrend is underway, oversold bounces and counter trend rallies are still possible. The harami shows firmness and we could see a bounce back to the gap and broken support (~145).
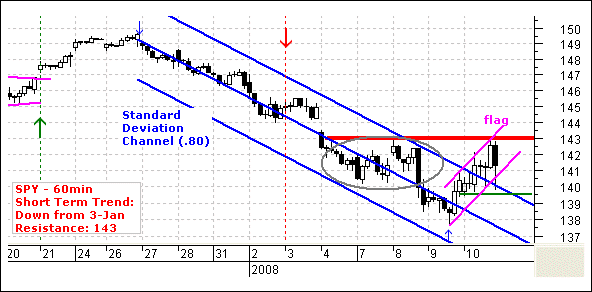
On the 60-minute chart, SPY broke above the Standard Deviation Channel and met resistance from the prior consolidation (gray oval). The channel break is positive, but the advance looks like a rising flag, which is potentially bearish. A break back below 139.5 would confirm the flag and target a move to around 136-137. Even though a break above key resistance at 143 would reverse the current downtrend, upside looks limited to the resistance zone on the daily chart (~145). The only play here is another short with a stop-loss just above 143. Personally, I find SPY too oversold for a new short position right now and I will remain on the sidelines.
Short-term Trend: Down from 3-Jan (red arrow/line).
Position: No position.
***Russell 2000 iShares (IWM)***
IWM gapped down and broke the support zone around 73-74. While this is clearly bearish, ETF became oversold on Tuesday and firmed the last two days. Broken support and the gap turn into resistance around 73-74. We could see an oversold bounce from here, but I would not expect too much.
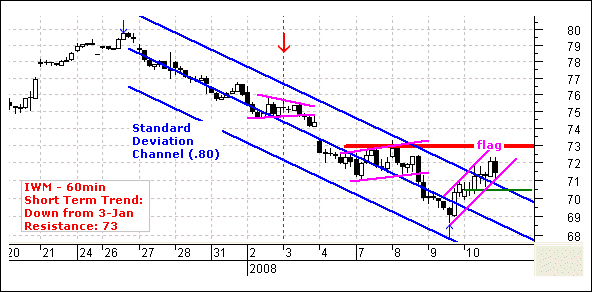
On the 60-minute chart, IWM also broke the Standard Deviation Channel and met resistance from the prior consolidation (7-8 Jan). The channel break is positive, but the advance looks like a rising flag, which is potentially bearish. A break back below 70.5 would confirm the flag and target a move to around 67-68. Even though a break above key resistance at 73 would reverse the short-term downtrend, upside looks limited to the resistance zone on the daily chart (~74). The only play here is another short with a stop-loss just above 73. Like SPY, I also find IWM too oversold for a new short position right now and I will remain on the sidelines.
Short-term Trend: Down from 3-Jan (red arrow/line).
Position: No position.
Good day and good trading -Arthur Hill
---------------------------------------------------------------
Click here to post a comment, suggestion or question.
Breadth Charts ---------------------------------
---------------------------------------------------------------
Disclaimer: Arthur Hill is not a registered investment advisor. The analysis presented is not a solicitation to buy, avoid, sell or sell short any security. Anyone using this analysis does so at his or her own risk. Arthur Hill and TD Trader assume no liability for the use of this analysis. There is no guarantee that the facts are accurate or that the analysis presented will be correct. Past performance does not guarantee future performance. Arthur Hill may have positions in the securities analyzed and these may have been taken before or after the analysis was present.
--------------------------------------------------------
about: The Daily Swing is posted every trading day around 6AM ET and focuses on short-term strategies for QQQQ, SPY and IWM. In addition, at two stock setups are featured every day with a detailed trading strategy. As warranted, coverage extends to broad market topics, key sectors and industry groups and inter-market securities (gold, bonds, the Dollar and oil).
--------------------------------------------------------
Sources: Data from Bloomberg.com, CBOT.com, Kitco.com and ino.com; Charting from Metastock (equis.com). Closing data from Reuters.com, eSignal.com, MS QuoteCenter and Yahoo! Finance.


