Jump to content


Photo

Elliott Gold Count (continued)


  • Please log in to reply
18 replies to this topic

#1 fib_1618

fib_1618

    Member

  • Traders-Talk User
  • 10,145 posts

Posted 13 October 2008 - 08:41 AM

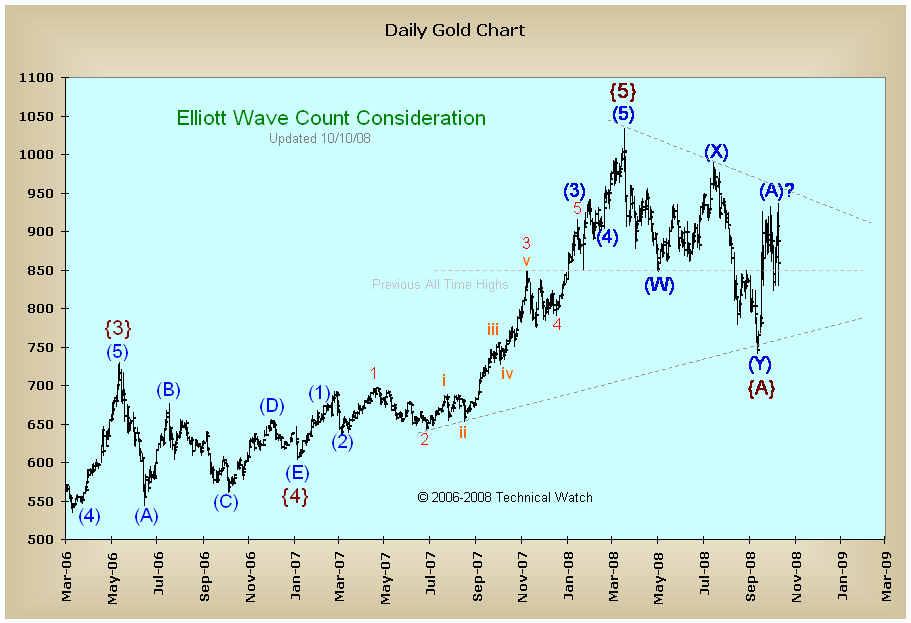
Count idea updated through Friday...further analysis can be found here.

Good trading

Fib

Posted Image

Better to ignore me than abhor me.

“Wise men don't need advice. Fools won't take it” - Benjamin Franklin


"Beware of false knowledge; it is more dangerous than ignorance" - George Bernard Shaw


Demagogue: A leader who makes use of popular prejudices, false claims and promises in order to gain power.

Technical Watch Subscriptions


#2 cgnx

cgnx

    Member

  • Traders-Talk User
  • 2,103 posts

Posted 13 October 2008 - 10:10 AM

Anybody know what that chart means? or portends?
If it can be cornered, it will.

#3 johngeorge

johngeorge

    Member

  • TT Member+
  • 4,616 posts

Posted 13 October 2008 - 11:07 AM

Anybody know what that chart means? or portends?


To me it looks like a
Symmetrical Triangle (Continuation)


http://stockcharts.c...trical_triangle
Peace
johngeorge

#4 cgnx

cgnx

    Member

  • Traders-Talk User
  • 2,103 posts

Posted 13 October 2008 - 11:10 AM

Could be a polygraph test? I assume with the triangle pictured he is alluding that we trade within that range until it doesnt. My guess.
If it can be cornered, it will.

#5 Jnavin

Jnavin

    Member

  • TT Member*
  • 2,126 posts

Posted 13 October 2008 - 11:55 AM

Short-term bullish...to about 950 or so. Long-term bearish...back down to 550.

#6 Islander

Islander

    Member

  • Traders-Talk User
  • 2,551 posts

Posted 13 October 2008 - 12:01 PM

This pattern in the gold market is indeterminate as a rule, but in the EW framework the breakout direction is usually the entry pattern direction and it tends to be about half of the amplitude. I think bullish is 60% probable.

That plus the current actions of the Fed are pointing up. If not we wait, the outcome of current policy is not in question: it is inflationary and gold must rise.

Best, Islander.

#7 dharma

dharma

    Member

  • Traders-Talk User
  • 9,625 posts

Posted 13 October 2008 - 12:22 PM

This pattern in the gold market is indeterminate as a rule, but in the EW framework the breakout direction is usually the entry pattern direction and it tends to be about half of the amplitude. I think bullish is 60% probable.

That plus the current actions of the Fed are pointing up. If not we wait, the outcome of current policy is not in question: it is inflationary and gold must rise.

Best, Islander.

i agree. however, if the deflationary tidal wave continues to assert dominance, i think that too will be bullish for the metal. so called money today, is all debt and a debt implosion leads us to real money which has no debt. dharma

Edited by dharma, 13 October 2008 - 12:24 PM.


#8 cgnx

cgnx

    Member

  • Traders-Talk User
  • 2,103 posts

Posted 13 October 2008 - 12:55 PM

Way to think outside the box Dharma. I say either way gold goes up too. Your Momma wears Crox. :lol:
If it can be cornered, it will.

#9 Jnavin

Jnavin

    Member

  • TT Member*
  • 2,126 posts

Posted 13 October 2008 - 01:00 PM

The "A" wave up (from the "Y") is a 5-wave structure, so it could be a 1. If Gold closes above the "X" wave, the down count is negated.

#10 senorBS

senorBS

    Member

  • TT Member+
  • 10,967 posts

Posted 13 October 2008 - 01:09 PM

The "A" wave up (from the "Y") is a 5-wave structure, so it could be a 1.
If Gold closes above the "X" wave, the down count is negated.


This Senor agrees with

NO BS

Senor