Jump to content


Photo

Elliott Gold Count (continued)


  • Please log in to reply
18 replies to this topic

#11 dharma

dharma

    Member

  • Traders-Talk User
  • 9,625 posts

Posted 13 October 2008 - 01:37 PM

The "A" wave up (from the "Y") is a 5-wave structure, so it could be a 1.
If Gold closes above the "X" wave, the down count is negated.

that is the bullish count and the one that i am favoring. in bull markets one has to give the benefit of the doubt to the bull. "do not mistake genius for a bull market. "
obviously there are bearish possibilities too. but they are on the back burner for now.

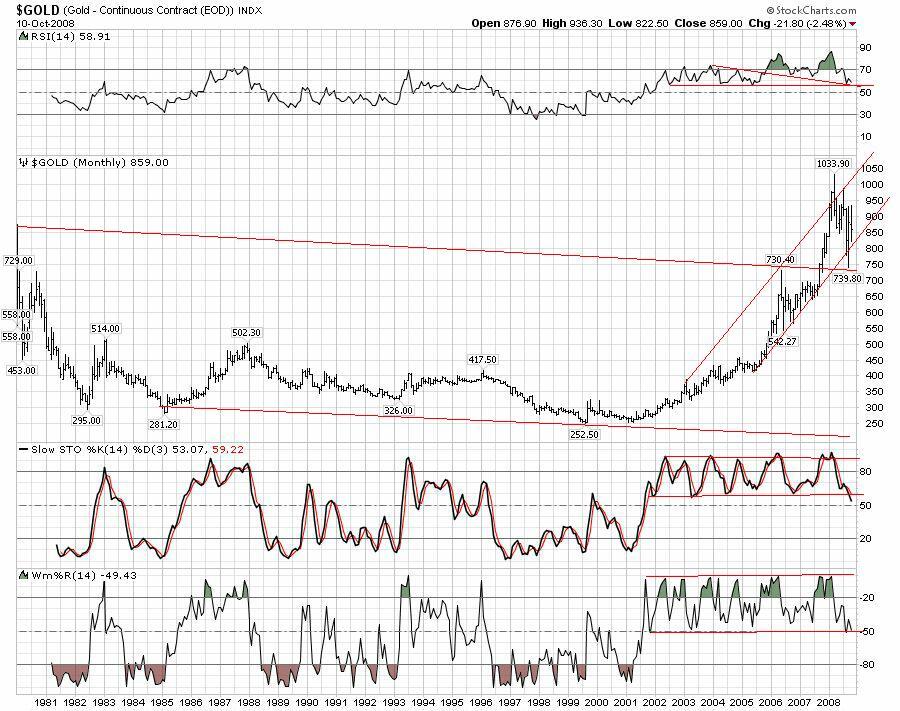
one last thought if one puts up a monthly gold chart, the pattern since the highs looks very bullish and is constructive. now, i know for traders monthly charts are not a top priority. i am an investor in this sector until it expresses itself fully
dharma

Edited by dharma, 13 October 2008 - 01:40 PM.


#12 Jnavin

Jnavin

    Member

  • TT Member*
  • 2,126 posts

Posted 13 October 2008 - 02:37 PM

Thanks, Fib, for sharing your chartwork with us. I appreciate your generosity.

#13 gvc

gvc

    Member

  • Traders-Talk User
  • 409 posts

Posted 13 October 2008 - 03:50 PM

one last thought if one puts up a monthly gold chart, the pattern since the highs looks very bullish and is constructive. now, i know for traders monthly charts are not a top priority. i am an investor in this sector until it expresses itself fully
dharma


mgold.jpg

#14 stubaby

stubaby

    Member

  • Traders-Talk User
  • 1,661 posts

Posted 13 October 2008 - 05:47 PM

one last thought if one puts up a monthly gold chart, the pattern since the highs looks very bullish and is constructive. now, i know for traders monthly charts are not a top priority. i am an investor in this sector until it expresses itself fully
dharma


mgold.jpg


gvc

Thanks for the chart - that REALLY puts this in perspective! Massive deflationary liquidations as the credit bubble bursts and the monthly chart is still holding up! Now that the spigots are wide open we should see a massive rally at least to the upper trend-line in your chart by the end of the 1st Quarter 2009.

stubaby

#15 senorBS

senorBS

    Member

  • TT Member+
  • 10,967 posts

Posted 13 October 2008 - 05:50 PM

one last thought if one puts up a monthly gold chart, the pattern since the highs looks very bullish and is constructive. now, i know for traders monthly charts are not a top priority. i am an investor in this sector until it expresses itself fully
dharma


mgold.jpg


gvc

Thanks for the chart - that REALLY puts this in perspective! Massive deflationary liquidations as the credit bubble bursts and the monthly chart is still holding up! Now that the spigots are wide open we should see a massive rally at least to the upper trend-line in your chart by the end of the 1st Quarter 2009.

stubaby


GLD daily chart filters out a lot of the crazy overnight Futures swings, to Senor it has a bueno cinco up daily and a wave dos correction completing here, next move a possible big TRES wave norte of 1000.

BSing away

Senor

#16 dharma

dharma

    Member

  • Traders-Talk User
  • 9,625 posts

Posted 13 October 2008 - 06:10 PM

one last thought if one puts up a monthly gold chart, the pattern since the highs looks very bullish and is constructive. now, i know for traders monthly charts are not a top priority. i am an investor in this sector until it expresses itself fully
dharma


mgold.jpg


gvc

Thanks for the chart - that REALLY puts this in perspective! Massive deflationary liquidations as the credit bubble bursts and the monthly chart is still holding up! Now that the spigots are wide open we should see a massive rally at least to the upper trend-line in your chart by the end of the 1st Quarter 2009.

stubaby


GLD daily chart filters out a lot of the crazy overnight Futures swings, to Senor it has a bueno cinco up daily and a wave dos correction completing here, next move a possible big TRES wave norte of 1000.

BSing away

Senor

yes, that is what it looks like to me. when everyone is pulling their hair out, it is a time to be quiet and pour over the charts. and to top it off, there is no physical to be had . eagles @tulving @99 over spot. sure they knock around paper, it is just a game. no cbs are selling gold, not even spain or portugal, and they were in dire straits before it became fashionable. and all these bank bailouts world wide, where is the money coming from? as far as i can tell, no one is preempting, but reacting. dharma

#17 tradesurfer

tradesurfer

    Member

  • Traders-Talk User
  • 2,944 posts

Posted 13 October 2008 - 06:44 PM

so if RSI or williams percent R breaks below support, then we are to conclude that the long term bull is going into a 1 to 2 year pause and decline ? Seems that is what this chart is saying.... The bulls live above the 50th percentile line....

#18 dougie

dougie

    Member

  • Traders-Talk User
  • 9,071 posts

Posted 14 October 2008 - 12:09 AM

you sure ther eare 5 waves there John? i only see 3 for usre

The "A" wave up (from the "Y") is a 5-wave structure, so it could be a 1.
If Gold closes above the "X" wave, the down count is negated.


#19 Jnavin

Jnavin

    Member

  • TT Member*
  • 2,126 posts

Posted 14 October 2008 - 03:07 PM

Yeah, dougies, it's a 5. Not clear on Fib's chart, but you see it clearly on other narrower-frame charts.