Edited by xD&Cox, 04 January 2007 - 05:06 PM.

Does utilities really lead the market?
Started by
A-ha
, Jan 04 2007 05:04 PM
12 replies to this topic
#1

A-ha
-
- Traders-Talk User
- 5,875 posts
Member
Posted 04 January 2007 - 05:04 PM
one of the analysts I respect, Jeffrey Saut from Raymond J. thinks so...
I personally believe the market is led by growth, especially Semiconductors because when the risk premium drops, that is the immediate segment that moves first... Just like how declining volatility (risk) in a declining stock market usually leads the upside reversal eventually....
I know this "utilities leads" theory is also followed by a few other old timers and I believe we will have an unique opportunity to observe its accuracy in coming weeks...
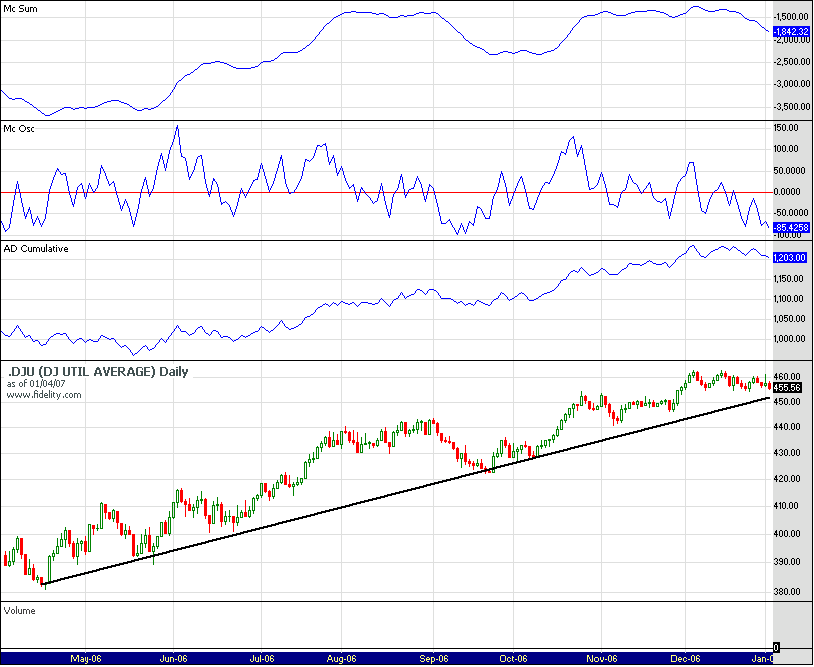
Why? Because I see utilities are topping like a mount everest here. This unique pattern, like many others I follow, are not in text books but it is one of the most powerful topping formations I know of.
Look at the one year daily chart of $DJU... Focus on the last 2-3 months. Yes that is the formation.
It also resolves in a unique way... A consistent waterfall.
But once again, I am not sure what that will mean for the broad market. Will it really lead or not. We shall see.
#2
dcengr
-

- Traders-Talk User
- 13,391 posts
Member
Posted 04 January 2007 - 05:20 PM
I don't see anything here...
Qui custodiet ipsos custodes?
#3
fib_1618
-

- Traders-Talk User
- 10,145 posts
Member
Posted 04 January 2007 - 05:36 PM
Except for the -1842 reading on the MCSUM which is impossible with a rising A/D line. You may want to point out this error to the data source for correction. My guess it's somewhere around the +1300 level by eyeballing the data. And with a such a high number, the likelihood of a price top of any degree is very low at this time.I don't see anything here...
Fib
Better to ignore me than abhor me.
“Wise men don't need advice. Fools won't take it” - Benjamin Franklin
"Beware of false knowledge; it is more dangerous than ignorance" - George Bernard Shaw
Demagogue: A leader who makes use of popular prejudices, false claims and promises in order to gain power.
Technical Watch Subscriptions
#4
A-ha
-
- Traders-Talk User
- 5,875 posts
Member
Posted 04 January 2007 - 05:43 PM
Patterns and trends are what makes the market. Not oscillators that are intended to measure what is seemably obvious on the price action.
I guess I heard that A/D line argument near the market top before Nas took a dive about %5
Edited by xD&Cox, 04 January 2007 - 05:43 PM.
#5
Sentient Being
-

- Traders-Talk User
- 4,262 posts
Member
Posted 04 January 2007 - 05:51 PM
I thought Utilities tended to outperform the S&P in the later part of an economic recesson. Of course, that could be the "utlities leading factor"? mayb they move first on the way down and move first on the way up?
I'd have to look at some charts and I can't right here and now.
In the end we retain from our studies only that which we practically apply.
~ Johann Wolfgang Von Goethe ~
~ Johann Wolfgang Von Goethe ~
#6
fib_1618
-
- Traders-Talk User
- 10,145 posts
Member
Posted 04 January 2007 - 06:06 PM
You're mixing apples with oranges xD, for whatever "unique pattern" you're seeing here, without having the underlying money flow base in a proper position for such patterns to "kick off", it's just another pattern of note, but certainly doesn't mean it will provide the desired outcome.Patterns and trends are what makes the market. Not oscillators that are intended to measure what is seemably obvious on the price action.
I guess I heard that A/D line argument near the market top before Nas took a dive about %5
I'm sure others, besides myself, are interested in this pattern you're actually seeing. Maybe you can present the pattern itself and then provide other examples as to the powerful weight you imply with your observation?
Actually, since utility companies are heavily into debt, they tend to lead the broader market out of economic bottoms, such as the 4 year low. Because of this, they're also very consistent in topping out well before the economic cycle actually peaks as interest rates are raised to fend off any inflationary tendencies that are a direct result of such expansions and this would then become a negative for this same sector.I thought Utilities tended to outperform the S&P in the later part of an economic recession.
Fib
Better to ignore me than abhor me.
“Wise men don't need advice. Fools won't take it” - Benjamin Franklin
"Beware of false knowledge; it is more dangerous than ignorance" - George Bernard Shaw
Demagogue: A leader who makes use of popular prejudices, false claims and promises in order to gain power.
Technical Watch Subscriptions
#7
dcengr
-
- Traders-Talk User
- 13,391 posts
Member
Posted 04 January 2007 - 07:08 PM
Except for the -1842 reading on the MCSUM which is impossible with a rising A/D line. You may want to point out this error to the data source for correction. My guess it's somewhere around the +1300 level by eyeballing the data. And with a such a high number, the likelihood of a price top of any degree is very low at this time.I don't see anything here...
Fib
The -1842 reading is because my dataset isn't complete (ie the history only goes back like 3-4 years). So yes, ignore it. The shape, however, is correct.
As for your call, its noted. Btw, I noticed you went flat not too long ago... do you plan on going long again soon or are market conditions still not to your likings?
Qui custodiet ipsos custodes?
#8
A-ha
-
- Traders-Talk User
- 5,875 posts
Member
Posted 04 January 2007 - 07:08 PM
You're mixing apples with oranges xD, for whatever "unique pattern" you're seeing here, without having the underlying money flow base in a proper position for such patterns to "kick off", it's just another pattern of note, but certainly doesn't mean it will provide the desired outcome.Patterns and trends are what makes the market. Not oscillators that are intended to measure what is seemably obvious on the price action.
I guess I heard that A/D line argument near the market top before Nas took a dive about %5
I'm sure others, besides myself, are interested in this pattern you're actually seeing. Maybe you can present the pattern itself and then provide other examples as to the powerful weight you imply with your observation?
Actually, since utility companies are heavily into debt, they tend to lead the broader market out of economic bottoms, such as the 4 year low. Because of this, they're also very consistent in topping out well before the economic cycle actually peaks as interest rates are raised to fend off any inflationary tendencies that are a direct result of such expansions and this would then become a negative for this same sector.I thought Utilities tended to outperform the S&P in the later part of an economic recession.
Fib
The question is how accurate A/D line can measure money flow. I don't think it is the most reliable way to do it. I dont know the most reliable way myself. But I know that A/D line doesnt work always. I can show you many tops that was built without A/D divergence. Some rallies are truly led by a few and the rest of the market follows them as long as they move. Until the leaders stop, usually you wont see an obvious A/D divergence. This occurs in mindless moves like terminals, parabolas. Main driver is sentiment and liquidity, not fundamentals. The end point is the point of saturation or the point where the big money decides to sell. That moment, everything turn on a dime and rolls over in a snow ball effect.
This is what is about to happen to Shangai index imo. Big money will sell at the exact multi decade pivot zone 2850. It could turn the euphoria into panic shortly.
Regarding the pattern I see on Utilities, I will try to find a few real example in a while.
#9
snorkels4
-

- Traders-Talk User
- 2,677 posts
bad guy
Posted 04 January 2007 - 07:12 PM
does? 
Andy House, Texas Man, Accidentally Drives 2006 Bugatti Veyron Into Salt Marsh
http://www.zimbio.co...Veyron Crashing
http://www.zimbio.co...Veyron Crashing
#10
dcengr
-
- Traders-Talk User
- 13,391 posts
Member
Posted 04 January 2007 - 07:13 PM
You're mixing apples with oranges xD, for whatever "unique pattern" you're seeing here, without having the underlying money flow base in a proper position for such patterns to "kick off", it's just another pattern of note, but certainly doesn't mean it will provide the desired outcome.Patterns and trends are what makes the market. Not oscillators that are intended to measure what is seemably obvious on the price action.
I guess I heard that A/D line argument near the market top before Nas took a dive about %5
I'm sure others, besides myself, are interested in this pattern you're actually seeing. Maybe you can present the pattern itself and then provide other examples as to the powerful weight you imply with your observation?
Actually, since utility companies are heavily into debt, they tend to lead the broader market out of economic bottoms, such as the 4 year low. Because of this, they're also very consistent in topping out well before the economic cycle actually peaks as interest rates are raised to fend off any inflationary tendencies that are a direct result of such expansions and this would then become a negative for this same sector.I thought Utilities tended to outperform the S&P in the later part of an economic recession.
Fib
The question is how accurate A/D line can measure money flow. I don't think it is the most reliable way to do it. I dont know the most reliable way myself. But I know that A/D line doesnt work always. I can show you many tops that was built without A/D divergence. Some rallies are truly led by a few and the rest of the market follows them as long as they move. Until the leaders stop, usually you wont see an obvious A/D divergence. This occurs in mindless moves like terminals, parabolas. Main driver is sentiment and liquidity, not fundamentals. The end point is the point of saturation or the point where the big money decides to sell. That moment, everything turn on a dime and rolls over in a snow ball effect.
This is what is about to happen to Shangai index imo. Big money will sell at the exact multi decade pivot zone 2850. It could turn the euphoria into panic shortly.
Regarding the pattern I see on Utilities, I will try to find a few real example in a while.
I think the story is that there are many tops of various types. Some tops CAN be spotted by A-D divergence, but not all tops. Some tops can be spotted by patterns, but again, not all tops.
Its not a sure bet for either, but it likely increases the odds quite a bit. If you see many signs of tops (ie A-D divergence, patterns, sentiment, etc), then your odds increase even more.
Qui custodiet ipsos custodes?


