This RSI2 system has not given a cover signal yet
#1
Posted 17 January 2007 - 10:00 PM
But thats better than normal, IMO. Plus the weakness of AAPL in AHs maybe a clue. What was also interesting was the very low $CPCE readings for a few days in a row. I'll check the odd-lot data tonight.. my guess is shorts piled on, which is more bullish, but may mean lower prices at least for the morning.
#2
Posted 17 January 2007 - 10:17 PM
#3
Posted 17 January 2007 - 10:21 PM
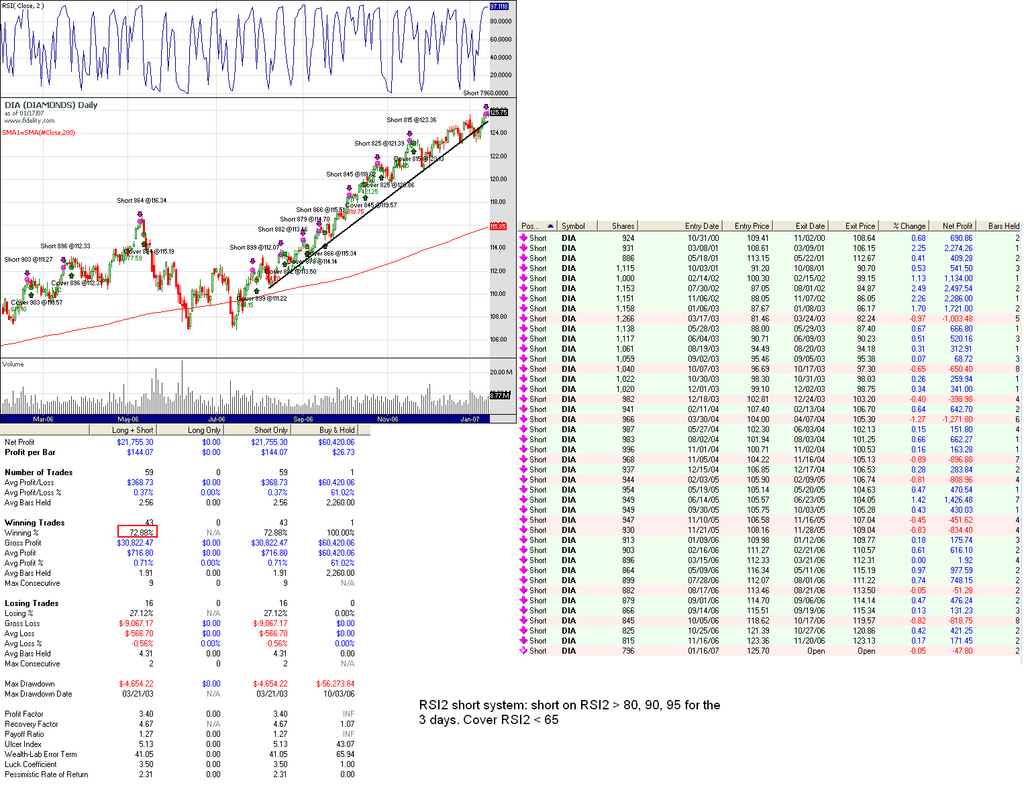
I'm not trading the Dow any more for a good while, not enough
volatility. I like choppy sideways trends.
I think we get a good bounce here but the Dow may not do much since it is still near the highs.
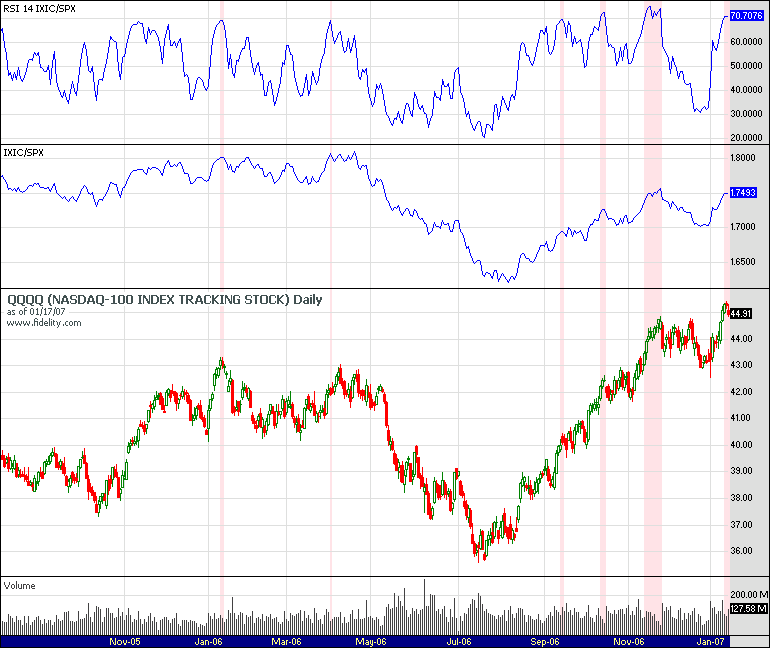
This system also applies to Qs, and it has met the requirement to cover at the close today.
But if you look at the RSI14 of IXIC/SPX ratio, you will note that it is still sky high, and that means IXIC sorta ran away from SPX a bit too much. Hence one way to equalize it is for the SPX (and Dow) to come down, but Nasdaq to come down even harder. Ofcourse, it can go the other way around.. for the Nasdaq to lag while the Dow and SPX go higher.
But since the RSI2 signal says Dow has gone up quite a bit, the odds favor that Dow must now go down, and IXIC must come down harder.
Edited by dcengr, 17 January 2007 - 10:22 PM.
#4
Posted 17 January 2007 - 10:33 PM
Ofcourse, the odds are 72%, not 100%.
But thats better than normal, IMO. Plus the weakness of AAPL in AHs maybe a clue. What was also interesting was the very low $CPCE readings for a few days in a row. I'll check the odd-lot data tonight.. my guess is shorts piled on, which is more bullish, but may mean lower prices at least for the morning.
DC,
Do u have these chart scripts published at Wealthlab?
#5
Posted 17 January 2007 - 10:44 PM
var Bar, Pane: integer;
var val: float;
Pane := CreatePane(75, true, true);
SetPaneMinMax( Pane, 0, 100 );
PlotSeries( RSISeries(#Close, 2), Pane, 005, #Thin );
DrawLabel( 'RSI( Close, 2 )', Pane );
SetAutoStopMode(#AsPercent);
InstallStopLoss(30);
InstallTimeBasedExit(30);
for Bar := 5 to BarCount - 1 do
begin
ApplyAutoStops( Bar );
if LastPositionActive() then
begin
if RSI(Bar, #Close, 2) < 65 then
CoverAtClose(Bar, LastPosition(), '');
end
else if ((RSI(Bar - 2, #Close, 2) > 80)
and (RSI(Bar - 1, #Close, 2) > 90)
and (RSI(Bar, #Close, 2) > 95)) then
begin
ShortAtClose(Bar, '');
end
end;
#6
Posted 17 January 2007 - 10:57 PM
No... sorta simple scripts..
var Bar, Pane: integer;
var val: float;
Pane := CreatePane(75, true, true);
SetPaneMinMax( Pane, 0, 100 );
PlotSeries( RSISeries(#Close, 2), Pane, 005, #Thin );
DrawLabel( 'RSI( Close, 2 )', Pane );
SetAutoStopMode(#AsPercent);
InstallStopLoss(30);
InstallTimeBasedExit(30);
for Bar := 5 to BarCount - 1 do
begin
ApplyAutoStops( Bar );
Thanks.
Why not publish for viewrs?
if LastPositionActive() then
begin
if RSI(Bar, #Close, 2) < 65 then
CoverAtClose(Bar, LastPosition(), '');
end
else if ((RSI(Bar - 2, #Close, 2) > 80)
and (RSI(Bar - 1, #Close, 2) > 90)
and (RSI(Bar, #Close, 2) > 95)) then
begin
ShortAtClose(Bar, '');
end
end;
#7
Posted 17 January 2007 - 11:10 PM