Continuing the discussion related to advancing stocks vs indices
#1
Posted 21 January 2007 - 02:07 PM
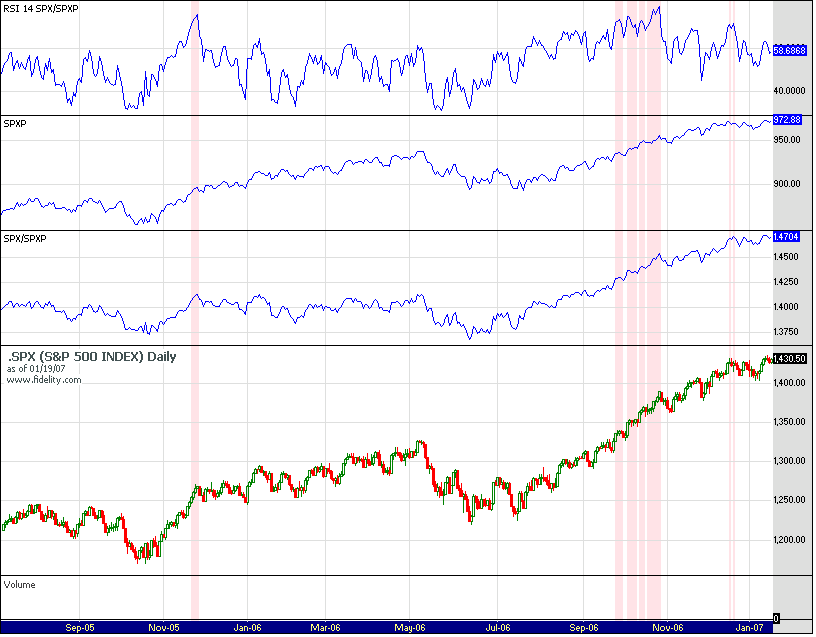
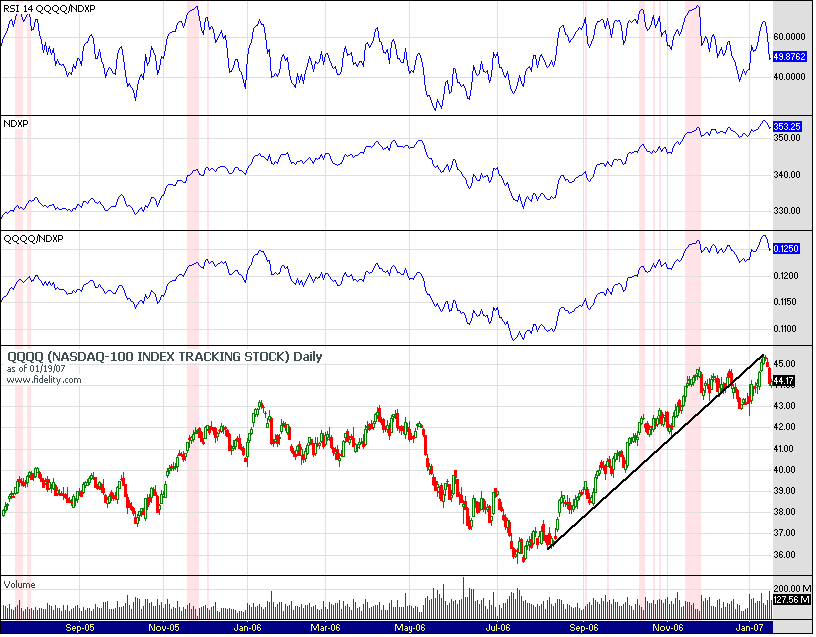
The value I call the SPXP and NDXP are created by taking the cumulative sum of the percentage gain of each stock in the index.
For instance, for the NDX, there are 100 stocks. The percent gain is (today's close - previous day's close)/previous day's close. This is repeated for each stock in the index, then summed up. Hence its an equal price weighted index.
The QQQQ/NDXP is merely as it states, a division of QQQQ/NDXP, and RSI14 is the RSI14 of that ratio. The bars are colored red if it exceeds 70.
#2
Posted 21 January 2007 - 02:49 PM
#3
Posted 21 January 2007 - 03:28 PM
#4
Posted 21 January 2007 - 03:44 PM
Another fly in the ointment for the bearish case relating to indices and stocks making new highs is that a large number of Dow components were making new highs or very close to making new highs earlier this week when the Dow closed at an all time high. I remember someone doing a study of this some time ago,(Jason Goepfert, Mortiz?) I can't remember who. At the time the dow was making a new 52 week high with only 5 stock also making a 52 week high. This obviously tended to indicate a weak foundation for further rally. Earlier this week we had about 15 stocks in the Dow either making a new 52 week high or very close to making a 52 week high.
I am not sure how much this adds to the discussion. I guess I am just looking for reasons I could be wrong given that I am bearish.
You are referring to this chart...
Yes someone made references to it.. I believe it was Dr. Eldar?
http://stockcharts.com/c-sc/sc?s=$NYHL&p=D&yr=3&mn=0&dy=0&i=p18674852194&a=94893892&r=6802.png
#5
Posted 21 January 2007 - 04:06 PM