Heres an approach for trade strategy development using chart pattern recognition in multiple timeframes. In this example, Im identifying stochastic indicator patterns in two timeframes or chart periods. Take a look at these Daily and 60 minute period charts.
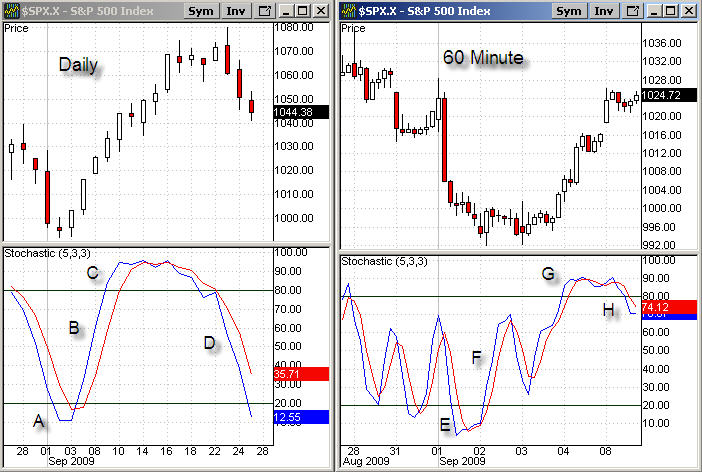
For the %K (fast line), Ive annotated the patterns by letters A-H. Each pattern can be described mathematically using indicator values for only one or two periods or bars.
Stochastic indicators are a great measure of price momentum, but less reliable when in the overbought (80%) or oversold (20%) condition, and when so, its usually a good idea to shift trading to shorter intervals using a shorter timeframe stochastic. The idea being let your profits run until overbought, then look for a good exit. This logic can be demonstrated in tabular format for two timeframes.
By identifying which patterns provide the best trade entry and exits, rules for trading can be established (A complete trade strategy will includes a set of rules, that when combined, can be expressed mathematically using Boolean algebra. This is just an example of an approach to pattern recognition, not a complete trade strategy solution.
Take a look at this table which maps out the patterns and rules that can be expressed using Boolean algebra.
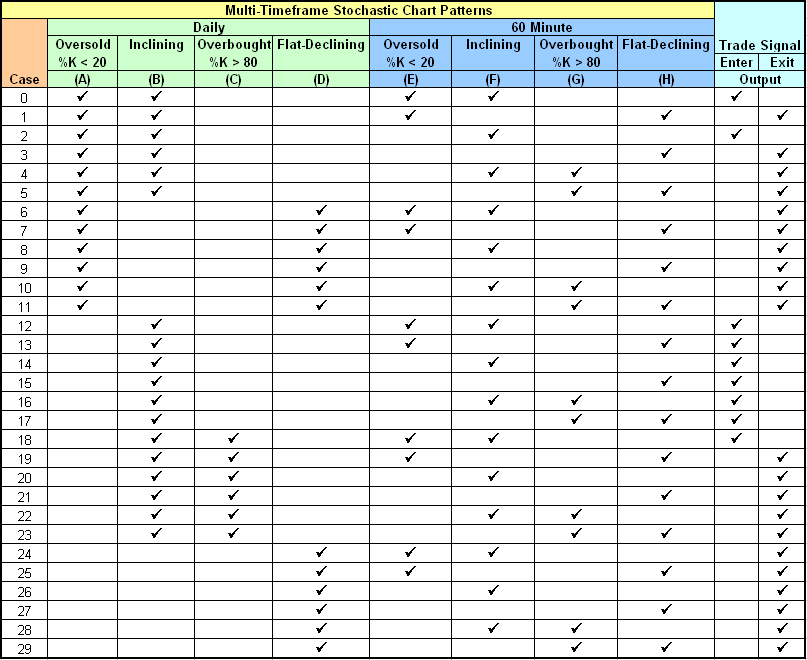
The table identifies 8 chart patterns or variables. Not all possible combinations are listed; for simplifications reasons it only identifies acceptable entry and exits. Using deductive reasoning or Boolean algebra, its possible that these 30 possible cases (9 entry and 21 exits) can be simplified into fewer cases.
Need a refreaher on Boolean algebra? Heres short video at eHow.com Short Video Boolean Algebra
You might recall my MACD guide post here on TT a while ago. Look here Guide To MACD and Price Strength A similar table for MACD & EMA chart patterns was provided, but I only hinted at a shortcut for the simplification method.
From the chart pattern table above, Ive constructed a truth table for the trade entry logic only.
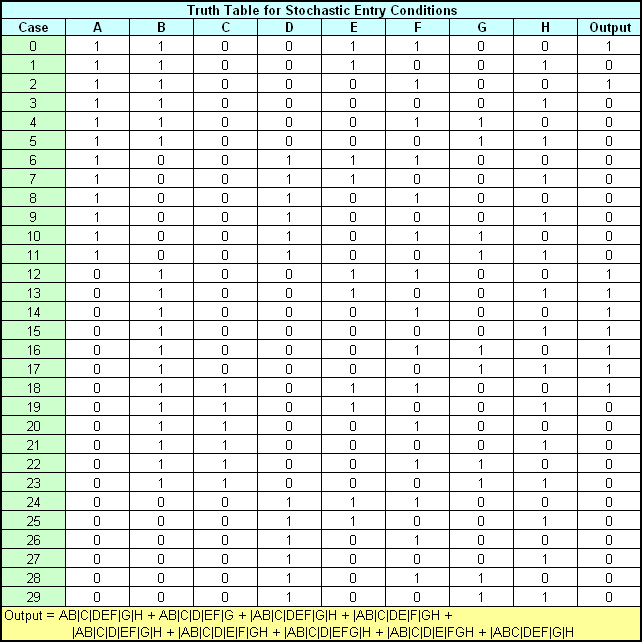
At the bottom, the truth table is expressed mathematically in Boolean algebra, where the + sign notation represents a logical OR and the | in front of some variables is a logical negation (e.g., |AB = A is not true, but B is true ).
Boolean algebra can be used to simplify the equation but may require some work. Heres a simplification example at eHow.com with a truth table of only three variables. How to Convert Boolean Algebra
Greater than three variables usually requires other simplification methods .

Searching the web, I found a freeware software solution called the Karnaugh Map Minimizer Ver 0.4 by Robert Kovacevic. Heres a screenshot, populated with my truth table and showing the simplification solution.
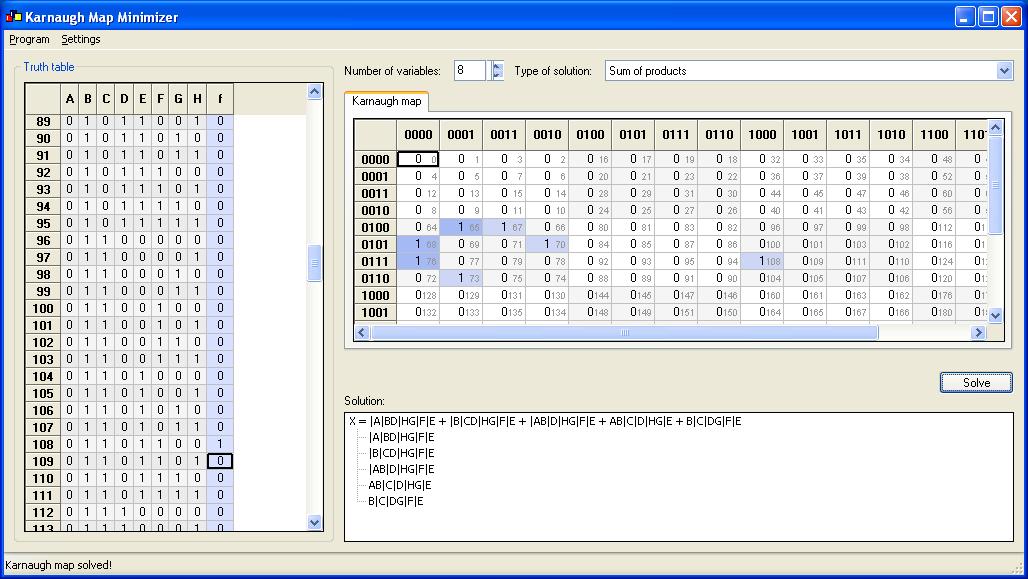
Problem is, due to programming errors in the application, it gives an incorrect simplified solution. Ive tested the program on 3 variables with success. There are a few other similar software applications to try, maybe later. The computer has no problem with the complex logic or running redundant conditional tests on many technical indicators. But code readability is easier with trade logic simplified. It will also make code modifications easier.
Good trading!