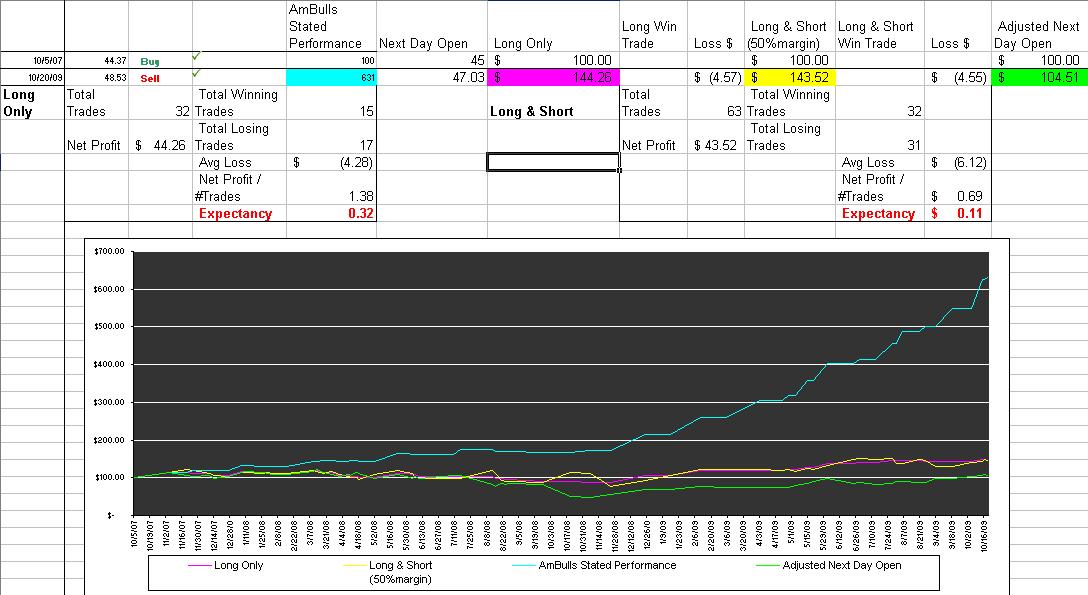
Following diogenes' advice, I put aside my laziness and did the backtesting again using the signal day's close price. Here're the 2-year results:
Long only:
Total profit: 90%. Expectancy: 0.64
Long & Short (50% margin):
Total profit: 92%. Expectancy: 0.22
So the performance is much better than using the next day's open price, although still way below their stated numbers.
0.64 expectancy is a good starting point. Combining it with some other longer term signal, and I think we may find something interesting.
Thanks for running those numbers. I don't know why they want to fudge their results -- 90 percent on the GDX is not bad.
As skeptical as I've been on their results because of their cockeyed use of the open entry criteria on the day of the buy and sell signals (which is virtually impossible to trade), I think there is something to using candlesticks the way they try to use them (but using the close as the entry point). Since you ran these numbers, I decided to get over a little of my laziness (but not all of it

) and quickly crunch a few numbers.
I took a look a LVS because I like the way that stock moves, and AAPL because everyone around here seems to hate it.
Using American Bulls buying and selling criteria on LVS would have yielded 13.8 points of profit on four long trades since 7/14. Great, but impossible to match in reality. Taking the same signals on the end of the day, which would have been easy to do, yielded 9.94 points on the same four trades. The first trade would have been at 7.14 so those 9.94 points represented 138 percent profit. One hundred and thirty-eight percent!
Using the American Bulls criteria on AAPL gained 58.59 points according to them on five trades since 6/25. Not bad. Using the end of the day to buy and sell AAPL instead yielded 59.19 points. What do you know, about the same.
Those two stocks were chosen at random and results like these may not hold up across the entire market but it looks like these guys at American Bulls are so busy talking pie in the sky they might not know they actually may have a real pie in the oven.

"If you've heard this story before, don't stop me because I'd like to hear it again," Groucho Marx (on market history?).
“I've learned in options trading simple is best and the obvious is often the most elusive to recognize.”
"The god of trading rewards persistence, experience and discipline, and absolutely nothing else."