S&P 500: Pop and Drop?By, Simon Maierhofer
Read more at https://www.ispyetf....mhs7ZVHfFDot.99
Up side Target (almost) Captured
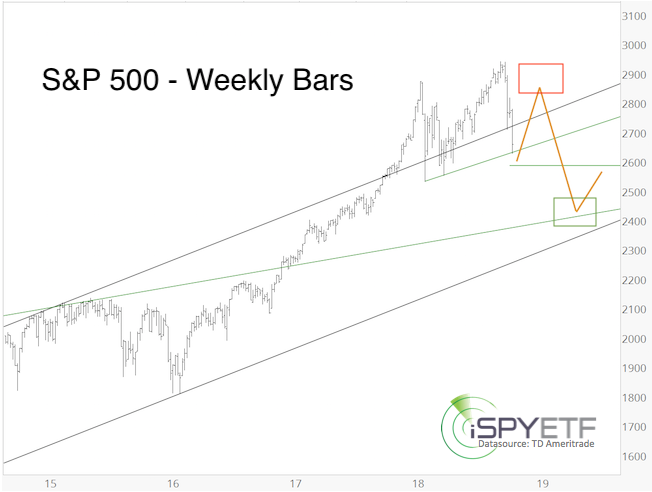
Since the up side target has almost been reached, it’s time to discuss the odds of a potentially scary ‘pop and drop’ scenario.
The October 28 Profit Radar Report stated that: “The projection (see chart above) provides a visual of the ideal path ahead. The upcoming bounce (either wave 2 or  should reach 2,830 and perhaps higher (wave B could even bring new all-time highs), followed by another leg down.”
At the time, it was not important whether the bounce is wave 2 or B. Why? Both had the same minimum target (around 2,830). Now that the S&P is close to the minimum target, it’s important to know the difference.
Wave 2 vs Wave B
- Wave 2: If this bounce is wave 2, it is not allowed to exceed the September high (2,940.91), and should ideally stop in the 2,812 - 2,869 range (61.8 - 78.6% Fibonacci retracement). Once complete, the wave 2 rally is followed by a strong wave 3 decline (along with waves 4 and 5).
- Wave B: If this bounce is wave B, it could, but does not have to, reach new all-time highs.
The chart below includes a number of updated resistance/target levels:
image: http://www.ispyetf.c...11718spxD_1.png
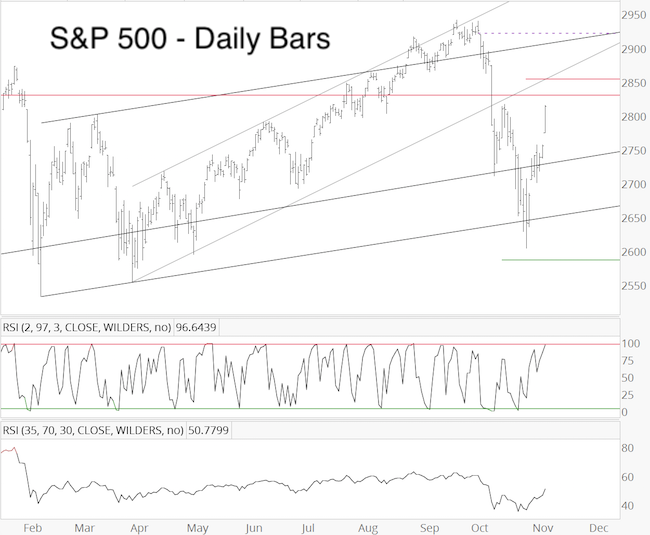
- 2,830: Fibonacci projection level going back to 2002
- 2,853: EWT wave A = C
- 2,869: 78.6% Fibonacci retracement
- 2,880 & 2,921: Open chart gaps, which tend to act like magnets for price
As of Wednesday's close, the S&P ended near over-bought, but without bearish divergences. This suggests short-term weakness should be followed by at least one more high.
Conclusion
It appears that at minimum another down/up sequence is required before a larger drop becomes an option.
Based on seasonality, continued gains and new all-time highs are possible.
I will be monitoring breadth, momentum and sentiment for extremes, internal weakness, or divergences to assess the odds of a serious reversal to the down side.
Read more at https://www.ispyetf....mhs7ZVHfFDot.99