I am in the CORRECTION camp, officially, as of last Friday. When will this correction occur? It may have already begun last week but it will not be all down. SPX 4K still possible before any major correction (more than 5%)
Only a Fool Tries to Call a Correction in a Bull Market, So Here Goes!
The Correction?
I have often argued that trying to call a correction in a bull market is a mugs game. That said, there are some things that worry me about the near-term outlook, not from a bear market point of view, but more in the way of a sideways correction. I guess what I am saying is that all bull markets are temporarily interrupted by corrective action, and now might be as good time as any to expect digestion of recent gains.
Chart 4 features the NYSE Bullish Percent indicator. On the one hand, it's very overextended, as it was in 2004 and 2009. Both situations were followed by sideways consolidations. On the other hand, such strong readings also represent a form of breadth thrust. A breadth thrust is an exceptionally overbought oscillator that occurs in the early stages of a bull market. You can see that because these corrections were part of the overall bullish trend, as flagged by the green arrows. Bottom line, while the current high reading suggests that the market may be risky for traders, it's a positive sign for long-term investors.
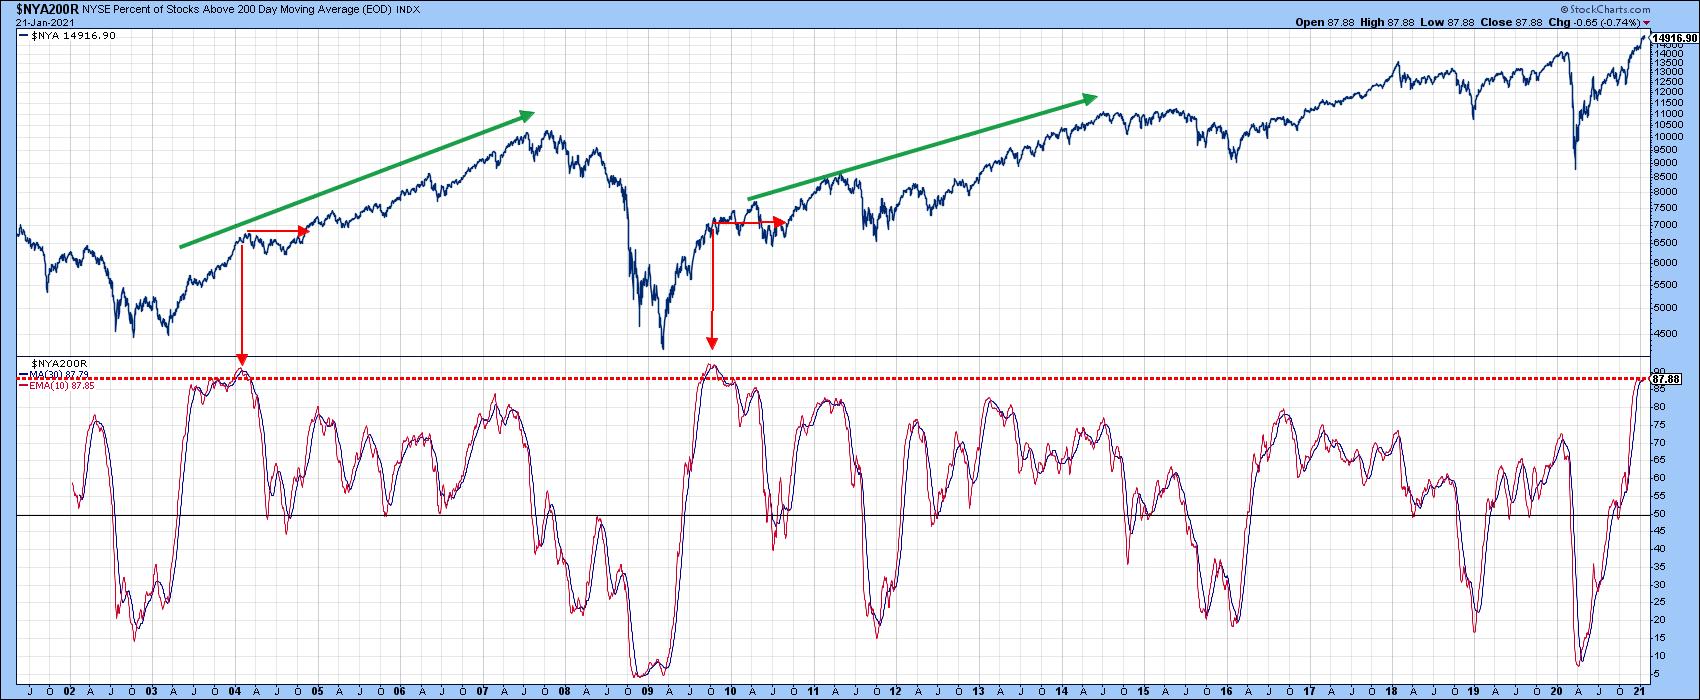 Chart 4
My Dow Diffusion indicator (Chart 5) triggers sell signals when it reverses to the downside from a reading above its red overbought line. Since 2015, such signals have consistently been followed by a downward or sideways correction. So far, the Dow's reaction has been to rise. However, the failure of the indicator to rally back above its MA is not a positive sign.
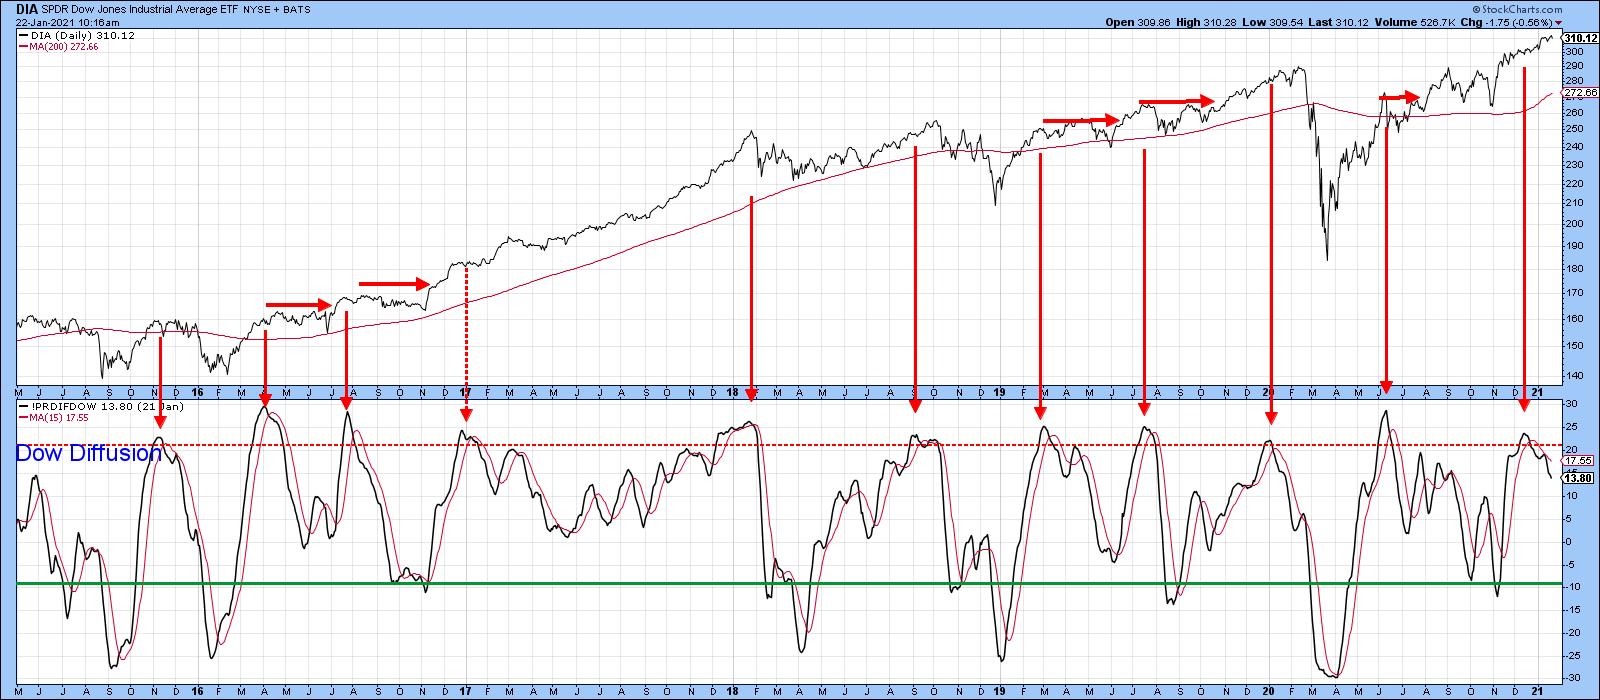 Chart 5
https://stockcharts....l-a-co-443.html