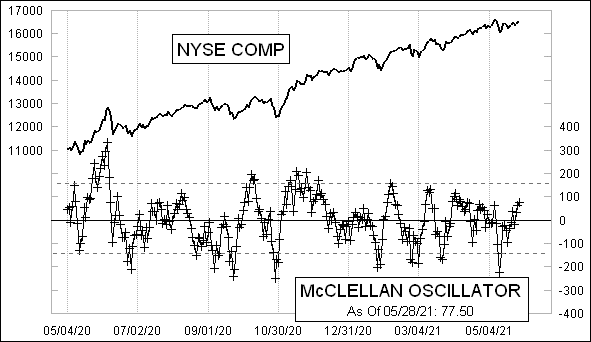
ORD is
SPX Monitoring Purposes; Long SPX on 5/19/21 at 4115.68.
Monitoring Purposes GOLD: Long GDX on 10/9/20 at 40.78.
Long Term SPX Monitor Purposes: Sold long SPX on 1/15/21 at 3768.25= gain 10.80%; Long SPX on 10/26/20 at 3400.97.
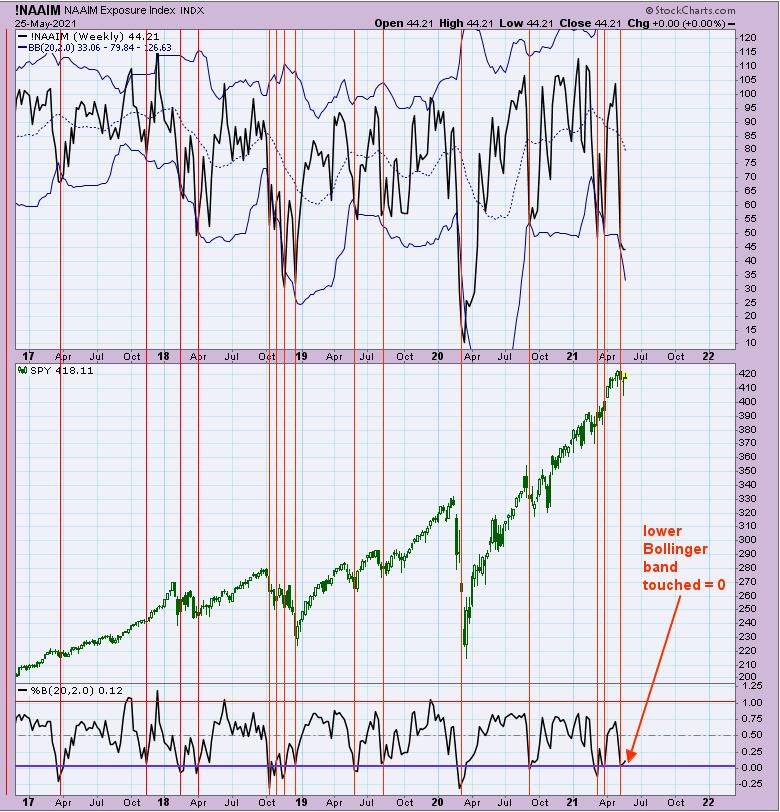
We showed this chart recently, now updated to today's close. The chart above is the weekly National Association of Active Investment Managers (NAAIM). The NAAIM Exposure Index represents the average exposure to US Equity markets reported by its members' current exposure index sets at 44.21% -- meaning the NAAIM have 44.21% of their assets in the market, which is pretty low. In the past, that has been a bullish level. We also look at the Bollinger Bands on the NAAIM and, when this index falls and hits its lower Bollinger Band, the market has been near a low. The bottom window is the Percent Bollinger Band; when "0" is reached, that means the lower Bollinger Band is touched (which was hit recently). Long SPX on 5/19/21 at 4115.68.
https://stockcharts....5-2021-255.html