
Ms. Price Said
Started by
iloli way
, Jan 07 2016 07:40 AM
16 replies to this topic
#11

iloli way
-
- TT Member*
-

- 4,028 posts
iloli = I'm Laws Of Line's I(eye)
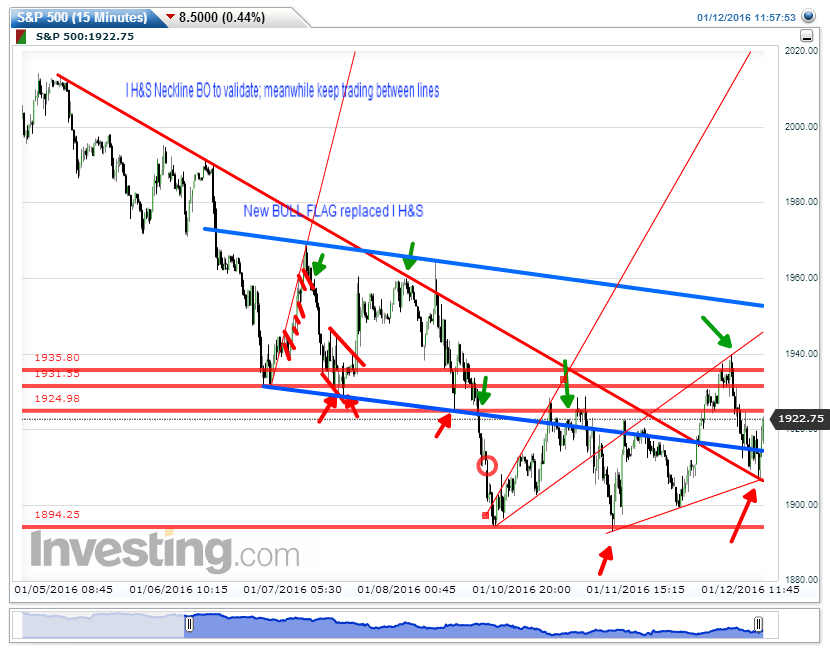
Posted 12 January 2016 - 03:21 PM
PRICE IS KING; LINE RULES! - Laws Of Line (LOL) Trading Systems
Swing Those Lines: I can calculate the motion of heavenly bodies, but not the madness of people! -- Issac Newton
Swing Those Lines: I can calculate the motion of heavenly bodies, but not the madness of people! -- Issac Newton
#12
iloli way
-
- TT Member*
-
- 4,028 posts
iloli = I'm Laws Of Line's I(eye)
Posted 12 January 2016 - 03:42 PM
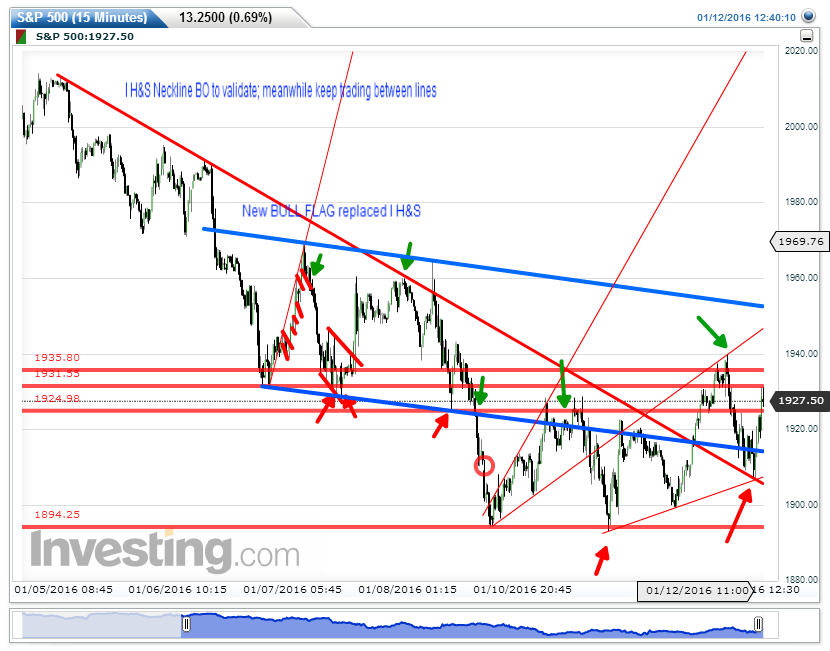
PRICE IS KING; LINE RULES! - Laws Of Line (LOL) Trading Systems
Swing Those Lines: I can calculate the motion of heavenly bodies, but not the madness of people! -- Issac Newton
Swing Those Lines: I can calculate the motion of heavenly bodies, but not the madness of people! -- Issac Newton
#13
iloli way
-
- TT Member*
-
- 4,028 posts
iloli = I'm Laws Of Line's I(eye)
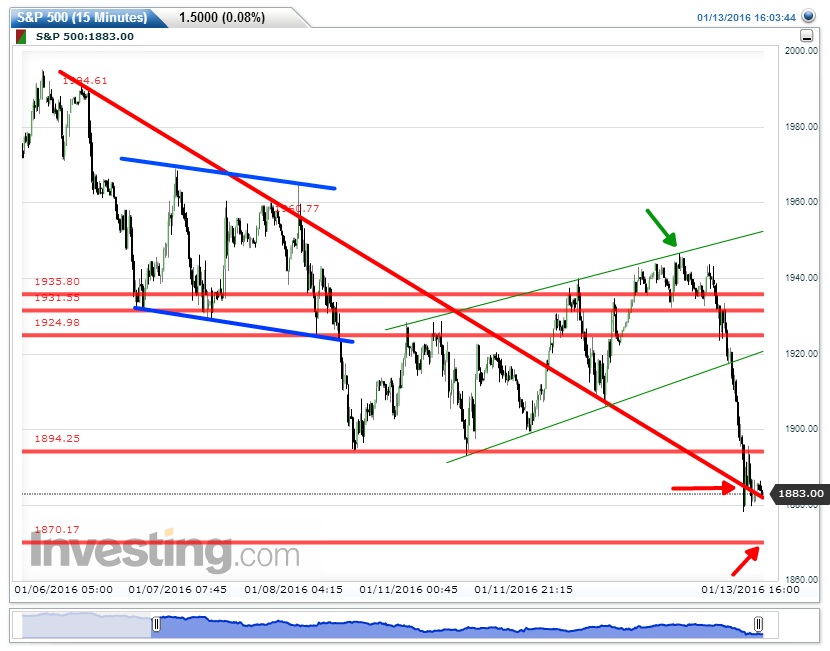
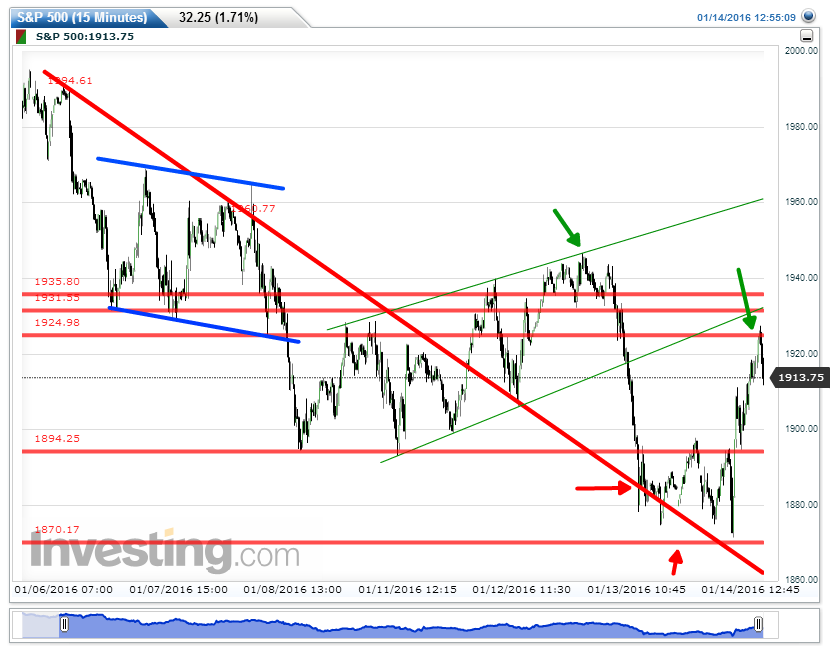
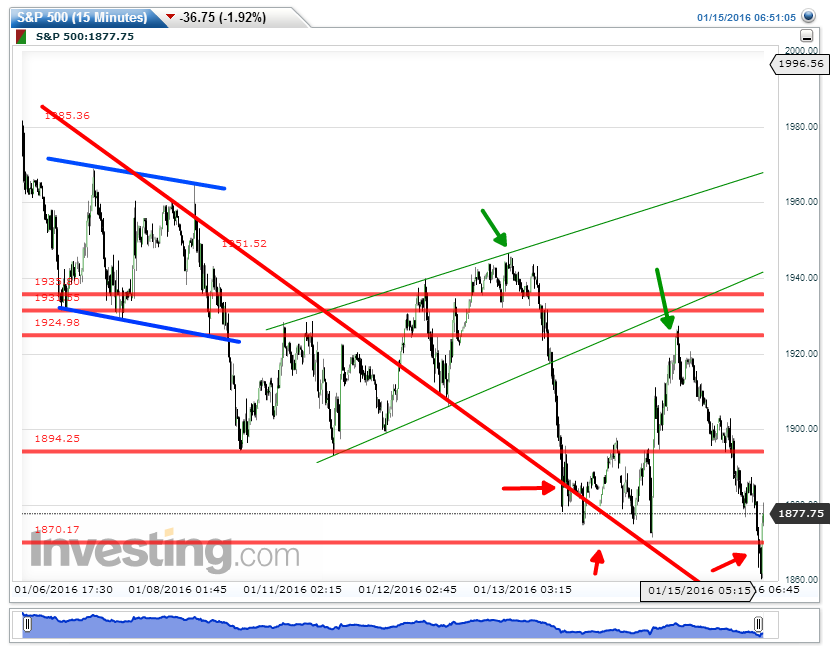
Posted 13 January 2016 - 07:50 PM
No time to post LT stuff as said I "should" but could not. My posts in past few few months are BEARISH, look them up. For example, I am probably the first one calling this as "BEAR FLAG" in October, so no need for me to pile on when EVERYONE finally see it now: lol!
http://www.traders-t...e-gap/?p=733619
This thread is about VST/ ST trading.
(Windows updated last night, erased all my lines/work; I redrew major lines same as shown before, in consistent with previous chart's; red arrow buy, green arrow sell)
PRICE IS KING; LINE RULES! - Laws Of Line (LOL) Trading Systems
Swing Those Lines: I can calculate the motion of heavenly bodies, but not the madness of people! -- Issac Newton
Swing Those Lines: I can calculate the motion of heavenly bodies, but not the madness of people! -- Issac Newton
#14
iloli way
-
- TT Member*
-
- 4,028 posts
iloli = I'm Laws Of Line's I(eye)
Posted 13 January 2016 - 07:58 PM
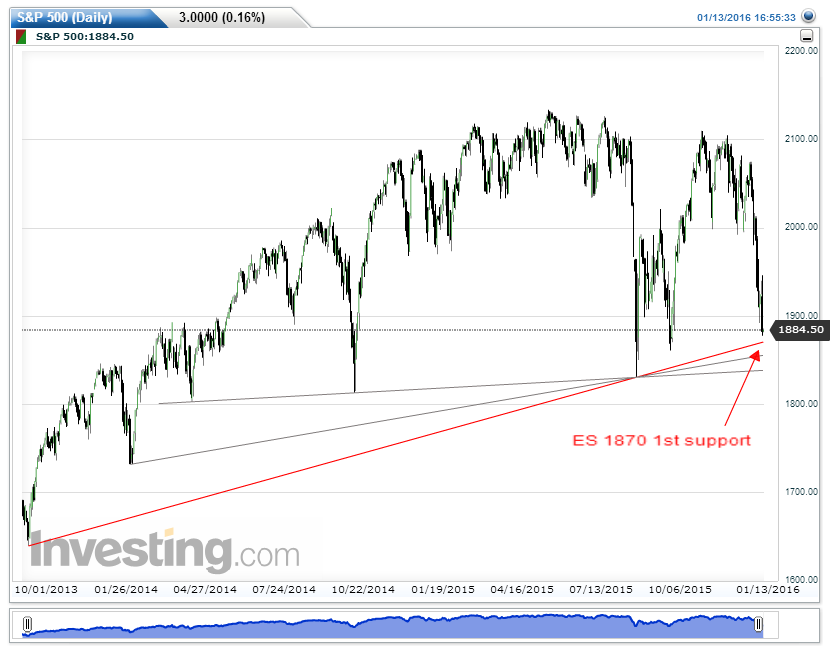
PRICE IS KING; LINE RULES! - Laws Of Line (LOL) Trading Systems
Swing Those Lines: I can calculate the motion of heavenly bodies, but not the madness of people! -- Issac Newton
Swing Those Lines: I can calculate the motion of heavenly bodies, but not the madness of people! -- Issac Newton
#15
iloli way
-
- TT Member*
-
- 4,028 posts
iloli = I'm Laws Of Line's I(eye)
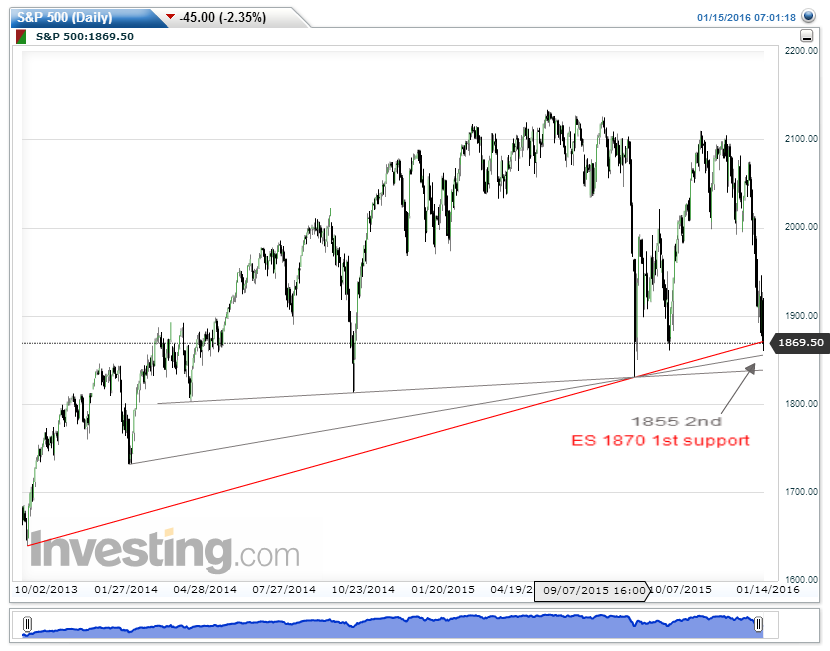
Posted 15 January 2016 - 10:34 AM
Now I am done with this set of ST/VST tradings. Covered last short from yesterday and gone for weekend. Next two supports on daily are critical. The 3rd support is the real H&S Neckline!! I still owe you one, but with free fall like this you don't really need my LT bear forecasts do you? I rather do this wire walking, save the marshmallow from fire type of ST trades between lines and pattern. More challenging to my LOL tastes... LOL! Get ready for barn burning squeeeza any time. Take care.
PRICE IS KING; LINE RULES! - Laws Of Line (LOL) Trading Systems
Swing Those Lines: I can calculate the motion of heavenly bodies, but not the madness of people! -- Issac Newton
Swing Those Lines: I can calculate the motion of heavenly bodies, but not the madness of people! -- Issac Newton
#16
iloli way
-
- TT Member*
-
- 4,028 posts
iloli = I'm Laws Of Line's I(eye)
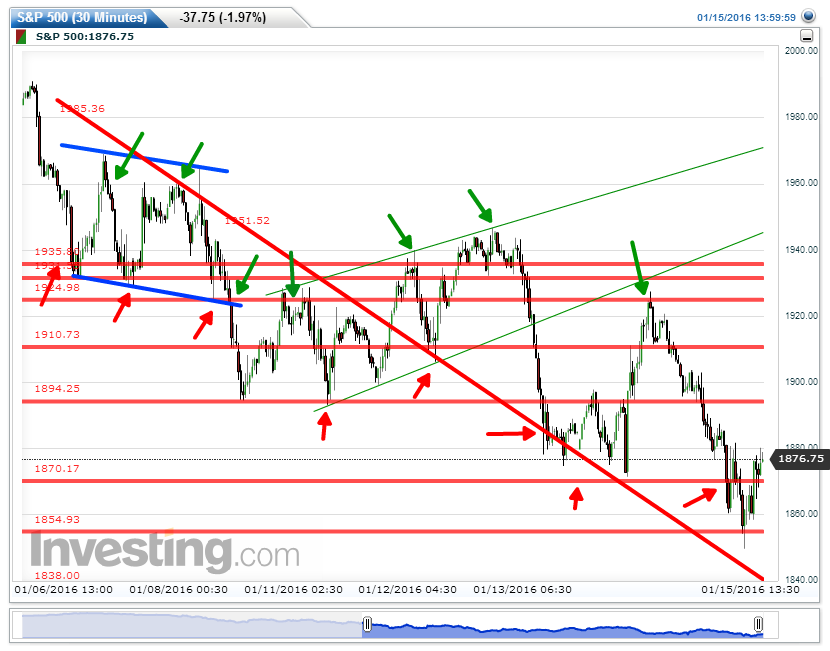
Posted 18 January 2016 - 10:33 AM
I must use 30m chart now to show all of my lines and trades (red arrows buy, green sell)to include posts from Jan 7th up to Fri's close. The 5m, 15 min charts can no longer cover that growing time span.
Red horizontal lines started from high to low served as buy, stop, or target price level, together with patterns and arrows, were all mentioned first before they are placed on charts.
All arrows, trade orders, as you can see were triggered when they are AT or HIT or CROSS the lines, patterns, line+pattern, targets, stops,..etc; whenever time and price (X and Y of chart), give me a specific point on a chart to act upon, so I did accordingly. That's the execution part, not just analyzing part, of my LOL systems.
Tell me if this chart has any discrepancy overlooked by me compare to my earlier posts, or ask me a question, so I know you still care.
I will post that "83-day-old history" soon (now it's 93 days, could be 103, 113, ... days who knows), but it will be Ms. Price's decision to tell me 'when' to post.
PRICE IS KING; LINE RULES! - Laws Of Line (LOL) Trading Systems
Swing Those Lines: I can calculate the motion of heavenly bodies, but not the madness of people! -- Issac Newton
Swing Those Lines: I can calculate the motion of heavenly bodies, but not the madness of people! -- Issac Newton
#17
Rogerdodger
-

- TT Member*
-
- 26,874 posts
Member
Posted 18 January 2016 - 10:42 AM
You have a good EYE! Thanks for posting.
I love those intra-day long steady moves that suddenly break the line in the afternoon.
"Nature's Failure to Function in a 'Predictable Way'... 500 years ago?"
BIGGEST SCIENCE SCANDAL EVER...Official records systematically 'adjusted'.
BIGGEST SCIENCE SCANDAL EVER...Official records systematically 'adjusted'.


