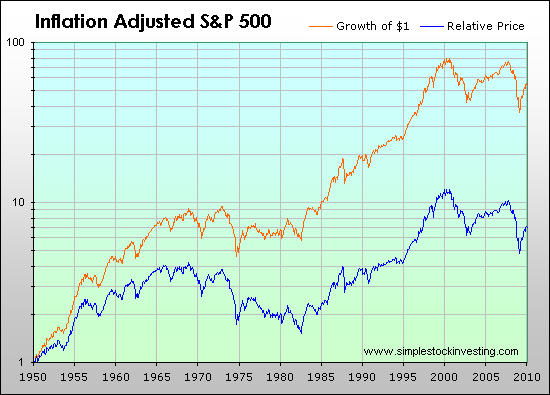
First, the secular trend, what I have always called the 20-year cycle, because each secular bull or bear trend lasts approximately 20 years, not coincidently what is commonly thought of as a "generation". There is an maxim of trading that says that "every generation speculates once" and I believe that to be true. Following each 20-year secular bull market we see a (approx) 20-year secular bear market, as those burned in the last cycle lick there wounds and a new generation is being raised up that will eventually become the next flock in this never ending cycle. Laundry and some others call this the 40-year cycle because that is approximate peak to peak/trough to trough length of time. Still others call it the secular trend or the generational trend.
Here is a chart of the DJ going back to around 1900:
[attachment=17361:djia1900sb.png]
Secular BULL markets are typically 18 (+ or - 3) year periods characterized by expanding valuations (P/E ratios, etc.), expanding public participation in equity markets, expanding speculation, and sharply rising prices. During a secular bull market, the entire Dow Jones Industrial Average or S&P500 will expand by as much as 10-15 fold or more. 1982 to 2000 was an excellent example of a secular bull market in all regards, as the Dow Jones Industrial Average expanded from the 700's to well over 10,000 in those 18 years. 2000, by the way, marked the valuation peak of the last few decades, though the nominal peak in prices occurred a bit later. This is normal.
Secular BEAR markets, by contrast, are periods of roughly the same length of time which are characterized by shrinking valuations, shrinking public participation, declining speculation, and range bound prices. The 1965 to 1982 secular bear market, for example, kept the Dow Jones Industrial Average range bound between roughly 500 and 1000 for that entire period as valuations, participation and speculation shrank markedly. The current secular bear market which began from the 2000 valuation peak clearly shares these characteristics, as even casual study will demonstrate.
Notice in the chart below 6 distinct secular cycles: 1909-1929 secular bull market (expanding), 1929-1945 secular bear (rangebound), 1945-1965 secular bull (expanding), 1965-1982 secular bear (rangebound). 1982-2000 secular bull (expanding), 2000-present secular bear (rangebound). We can expect that the current secular bear market, bound in the range of roughly DJ 6000-14000 to run until late in the next decade (2017+or-) at which time we can reasonably expect the onset of the next secular bull market which could take us another 15X+ higher to the area of 100,000 Dow Jones Industrial Average. {One more side note: Laundry observes that every other secular bear cycle goes to much deeper levels than the intervening secular bear low -his 80-year cycle - and if true, perhaps the current cycle takes us much lower than DJ 6000, SPX 600.}
Next, the cyclical trend - what I refer to as the cyclical bull market and cyclical bear market cycle:
http://stockcharts.com/c-sc/sc?s=$SPX&p=M&st=1996-01-28&i=p73030814314&a=181755078&r=21.png
Notice that the 13 month ema is still rising, but at a slowing rate, and that price recently penetrated that MA. While flashing a distinct warning, It is, nonetheless, still in primary Bull Market mode. This is one of the reasons I had been looking for the market to base out and rally towards or perhaps beyond the April highs.
Weekly charts are showing this weakness even more vividly, as price penetrated the 8 week EMA which in turn penetrated the 34 week EMA on the downside. In 2007 this happened in July just before the "last rally" of that cyclical bull market. And the MACD patterns here are similar to the Summer of 2007:
http://stockcharts.com/c-sc/sc?s=$SPX&p=W&yr=3&mn=6&dy=0&i=p68068785643&a=186901514&r=701.png
Looking at the daily, from a post below, Seven Sentinels are on buy mode, and using Terry laundry's "T" the top looks like August 6, though Terry talks about "August 26 or perhaps a bit earlier.": I believe the rally will be much stronger than most expect, and could well log a new SPX high, above the April levels. This would be the "external high" or the final high for the entire cycle which began on March 9, 2009, and would likely be unconfirmed by cumulative advance/declines as well as other internal measures. There is nothing cast in cement about the "new SPX" high however, and I'll be much more concerned with the message on the sentinels in August.
http://stockcharts.com/c-sc/sc?s=$NYMO&p=D&yr=0&mn=4&dy=15&i=p05860298919&a=199263752&r=955.png
Now beyond this top, it becomes really interesting, as I believe the new cyclical bear market will be ushered in with a vengence.
All of the above is my view, and I am not looking for agreement. If it conflicts with your view, that's as it should be. We each have our methods and our lens through which we view markets. Mine is all about "context". And it works for me. Very best trading to all, Don
----
PS Special thanks to Terry Laundry for some new tricks he taught me and to Rogerdodger for introducing his fine work here at FF.


