Wait till I explain in detail this weekend (try my best), maybe some of you picked up from my charts and already realized that.
A good chartist wants to be a good trader, first and most required quality is basic training of a historian. I have four years of college degree in study of history as background in my 18-22 age.
Second, for
pure price chartist, I insist one must abandon ALL of the canned, programmed TA indicator or oscillator or any -tors, and put your
fingers on the PULSE of Ms Price directly and come up with your own indicator to be totally self-confident on own tools: to me it is Laws Of Line... fortunately I also have had 30 years of graphic design training that started in CCAC 1973 that later morphed into a rewarding CAD/CAM/CAI career as a solid foundation for drawing precision lines and patterns on chart. I retired from working for big corp in silicon valley since 2001 (right before 911), and have applied my skills on charting and trading since 1989.
Third, once you have above two qualifications, the ability to discover a pattern, a passage way, a routine GPS, how prize behaves, acts, drives, moves so you can predict her goal, destination, target, or next stop point then becomes a must....price never stops long in the river of time and X,Y axis of a chart. Its a long river of history, some prefer VLT, some LT, Some ST, VST, DT; we are only happen to be
here and now that we can participate in jumping into the stream of flow and catch some fish if we are with the flow, or get drawn. After entry, a stop must placed is not even an issue; it's an auto prerequisite to be in trading. But now you say what about fake out, fake down? well giving a few points exceeding a line is within my tolerance, you are as good as a line as deep as your own pocket; but line has priority always before your pocket.
From posting here and my blog, tweet before, I found out there are probably 30% of the readership actually understood what I have to post. Of that, 90% become long term loyal readers and followed for the past 5 years once they are "hooked". Too bad I don't run biz on subscrition, at $10 a pop, I can fetch at least $500 a month on TT alone. But I insist making money on my own trades not on subs, that's just me; I paid too qhile was searching so I don't want you to pay for my mistake when it must happen sometimes. Unfortunately still 70% just dont get it, b/c they lack the qualities I mentioned above. It's not my language, it's insufficient training of study of history and price pattern of those 70% readers who are so programmed in only limit their own comfy box in barely relying on
FA talks and traditional indicator-pron TAs. How can I blame them, when that's the only pre-schooling they were exposed to?
Also, I am doing this in FF partly for SLECTO who once said supported my idea. Where are you selecto? Hope all is fine bud... long time no see your post...
So without further a due, let me fulfill my promised "explain in detail this weekend (try my best)", by using a section of the most critical important process last week as follow, as posted in PURPLE GAP, but with detail explanations of whys and hows behind said posts:
Chart title at left-upper corner "US SmallCap 2000" is CASH market; "SmallCap 2000" is the futures market. Just the way Investing.com used. All charts here were posted in my thread PURPLE GAP in real time, none was after the fact hind sight, ok?
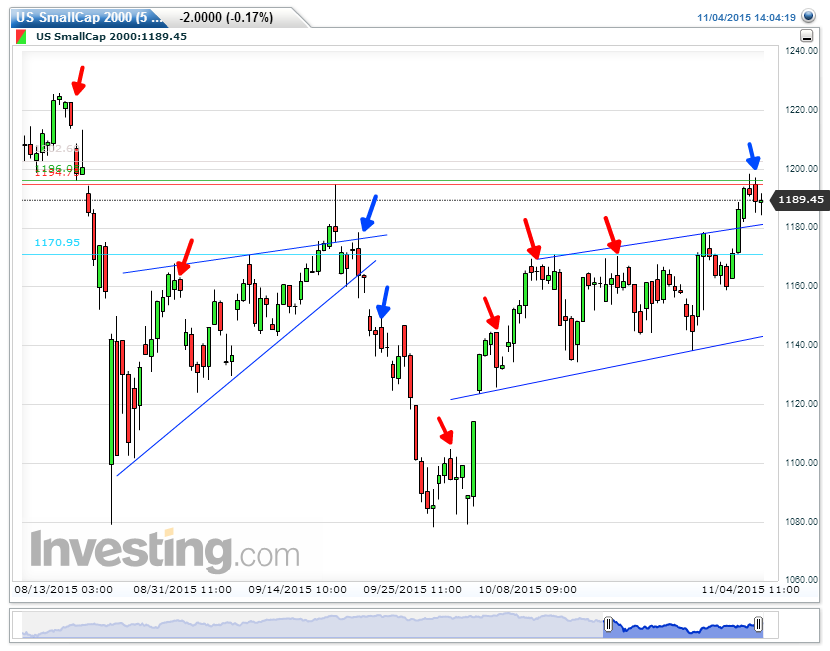
10/23 5min cash: 9:34AM, I saw the latest Red Rising Wedge BD, so I posted this chart with downside target at the bottom 1144.72. During trading session, I usually don't do precision lines, as if it's only for my own use, so decimal is really meaningless. But you should know I use Horizontal line only as Target indication, all other lines are slopping as provided by price when she tracing out a pattern that can never formed by a horizontal line.
20151023093502.png)
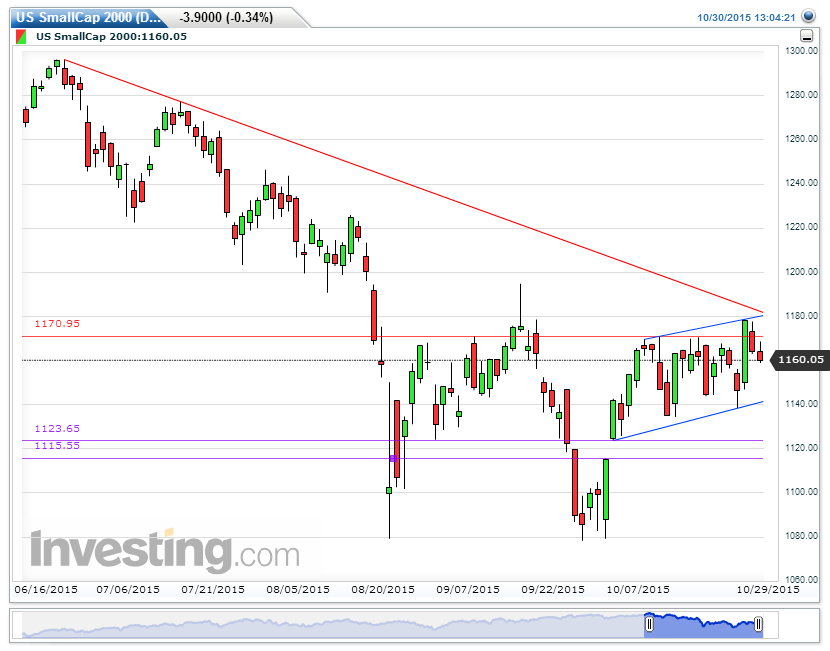
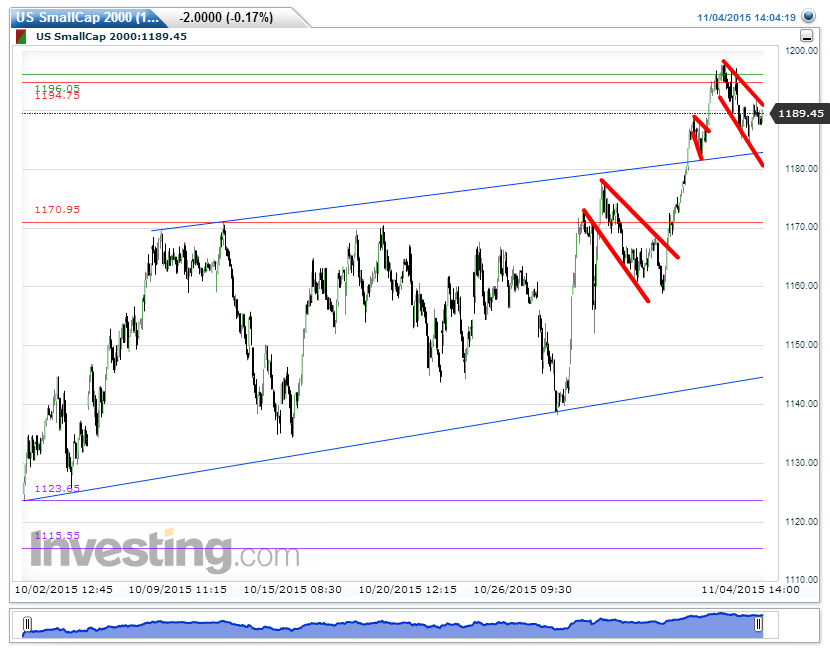
10/27 15min cash closed: I use 15min now b/c if I want to include the beginning of the patterns in the same frame before, I have to, as time progresses more spaces are needed. So, now we see after last chart price had advanced into previous high then turned back down to fulfill the target I gave her at 1144, then exceeded target, forming a bearish sickle as I also reported. At this point, next day should be very tough for bulls not to fall more, but the close above Red Target and stopped exactly on my Purple line is telling me the setup is to RIG IT in AHs and next day. That's why I put "LOOKOUT!" in the earlier gap and hinting this rigged next move would be another gap up as the lookout is located.. and noticed I added a top Red Horizontal Line there at 1170.95 in this chart and time, as to prepare for an assault by les bulls there to stop my IT position out. Really? You can bet on it! I did.
20151027132115.png)
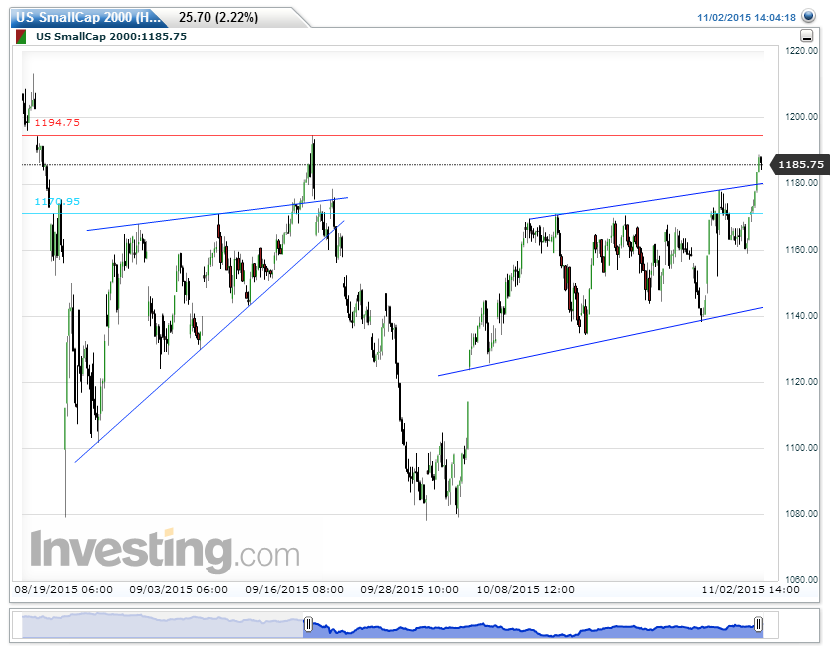
10/28 the "Beautifully done" Rigged (bear's nightmare) Day. It happened so swiftly and merciless. The RUT was used as a front-running horse, speed off right out the gate, way before SPX and other majors even showing any signs of rally... I knew for sure then that it was a rig. I did not have time to post, only too busy in DT and mind my own business. So until my IT trade of TZA 44.33 was stopped out at 43 = 1170.95 for the first time in 3 weeks, yet at the same time, I made three round-trip sauna profitable DTs, thanks to my Yellow Lines warning me a Descending Broadening Wedge was formed and broken with a target at above horizontal yellow line before even reaching the red line above. So the yellow pattern was the roadmap it was used by price to move. I posted to report this at EOD after a rest from the rare but exhausted trading day. As said this is not a day trading blow-by-blow thread, I don't do windows while I do my own tradings, sorry okay? LOL!
20151028210215.png)
10/28 EOD, as I scanned my other charts, this one posted 10/23 2PM futures chart "chart of day" caught my eyes as I originally commented
5 days ahead of this bull's assault that these 3 orange and red lines are hoped by bears to stop the bull's move, and it did just that
5 days later until now as I type thank you. I f LOL can predict 5-days move, I am for one is happy! So I immediately posted this heads-up before midnight on 10/28:
NEW REVERSAL TOP CAN BE TRIGGERED ANY MINUTE NOW AS THIS LAST CHART IS SAYING,
(remember that 'chart of the day' back in 10/23, see where price was stopped today by what lines?),
BE ALERT AND STAY TUNED.
20151025114324.png)
I circled the "stop" to show EOD status of futures and get ready to get back into IT short position again next day's cash market.
20151028133123.png)
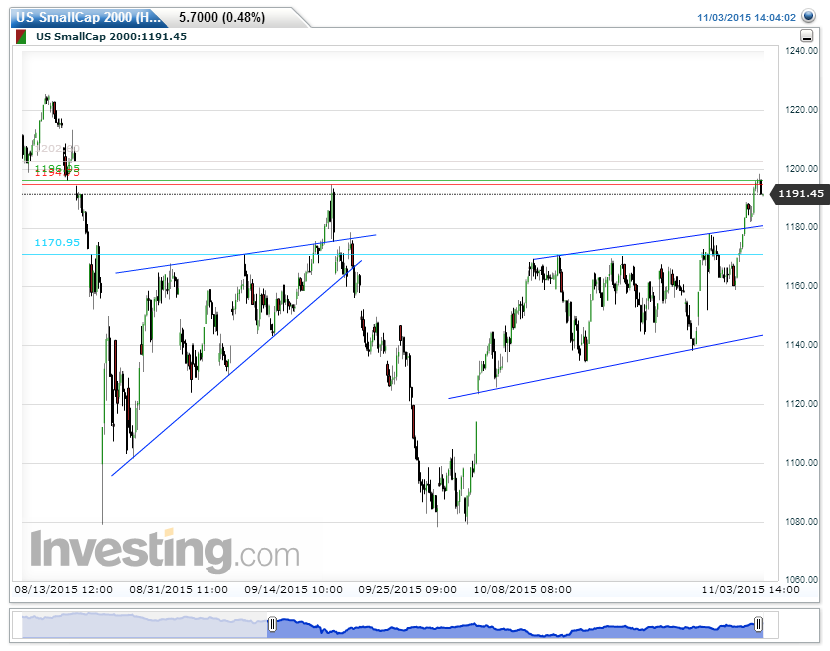
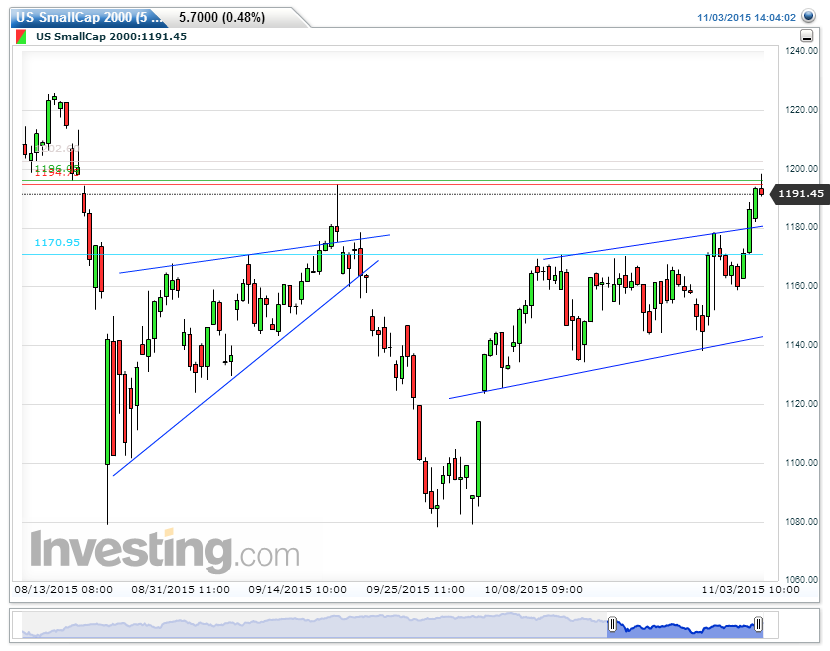
So, I did get back on short RUT cash(not IWM) with TAZ 42.55 with batter entry than last exit of 43. Chart below is a simplified version of last chart. Still Hourly, showing a BEARISH flag, same as cash daily's BLUE flag. Like any bear flag, the bottom line is the target in time, if BD that that is normal bearish move; if bounce back fiercely it is a struggling bulls to try to BO the bearish bias to flip into bulls favor; that's why I have a "shooting star" ready for the next adding short in line OR get stopped out. Detail read the PURPLE GAP thread. That was that at the end of Friday's close of futures. Now still at Sunday morning, lets wait till Monday or even afternoon futures open to see what brings next. Whatever it is, you can be sure as I watch them LOL always ahead of the actions, bulls bears or flat...hope I made myself and my LOL clear. If you still don't understand, just block me out, I am not talking to you anyway, and I don't mind if I EVER talking to you anyway...

caveat: I type along without too much reflections so am not responsible for standing up to any english writing class standard or missing what I meant to say. I am only human not a bot but can beat bots when profits count. Oh WTH, clicking the "Add Reply" now. Rest is history, you means nothing to me - my last words.
20151101014138.png)
Edited by iloliway, 01 November 2015 - 08:20 AM.


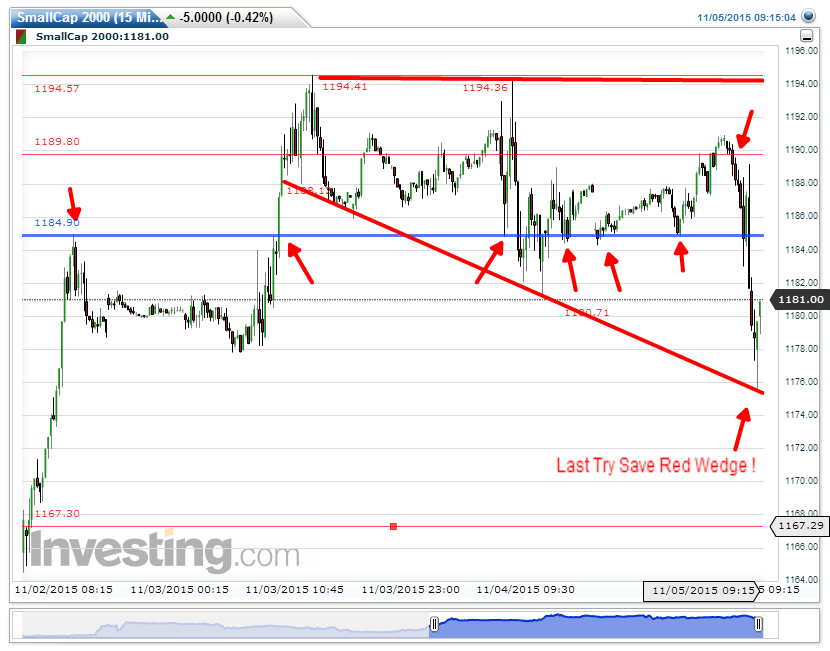
20151105083819.png)


