Jump to content


Photo

This indicator captures the market quite well....


  • Please log in to reply
14 replies to this topic

#1 nicolasillo

nicolasillo

    Member

  • Traders-Talk User
  • 1,441 posts

Posted 08 January 2009 - 04:38 AM

Lets see how well it does this time......

Posted Image

Edited by nicolasillo, 08 January 2009 - 04:41 AM.


#2 relax

relax

    Member

  • Traders-Talk User
  • 2,224 posts

Posted 08 January 2009 - 04:55 AM

nysi.png 
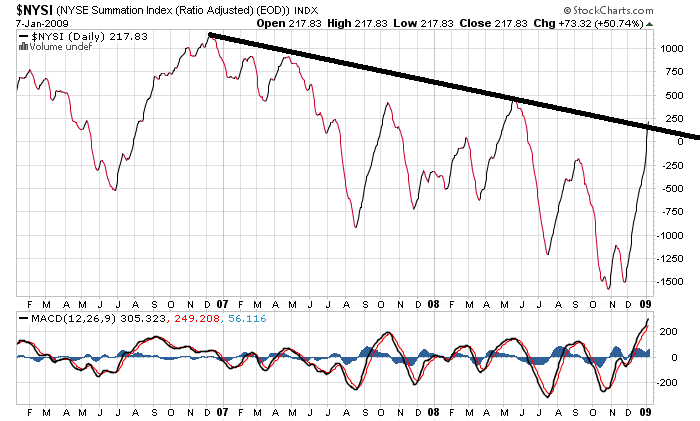
this captures what has been a power move resistance at 500 level and 750

#3 nicolasillo

nicolasillo

    Member

  • Traders-Talk User
  • 1,441 posts

Posted 08 January 2009 - 05:03 AM

could well be, and then I would have to label the moves on the indicator as ABC finishing big A, and now in big B which would take it to hit the red trendilne. For now I go with this count.

#4 relax

relax

    Member

  • Traders-Talk User
  • 2,224 posts

Posted 08 January 2009 - 05:33 AM

a big tell will be whether we get above 918-920 and then close yesterday's gap so far volume has really not been that big yet no 2 million hourly ES bars yet gap at 869 level is also worth keeping an eye on

#5 nicolasillo

nicolasillo

    Member

  • Traders-Talk User
  • 1,441 posts

Posted 08 January 2009 - 05:39 AM

agreed on whether we can close yesterday's gap.

Edited by nicolasillo, 08 January 2009 - 05:39 AM.


#6 spielchekr

spielchekr

    Member

  • Traders-Talk User
  • 3,104 posts

Posted 08 January 2009 - 07:57 AM

Nicolasillo:

Are you now taking credit for my indicators? (scroll down to 4th chart).
http://www.traders-t...showtopic=86565

#7 nicolasillo

nicolasillo

    Member

  • Traders-Talk User
  • 1,441 posts

Posted 08 January 2009 - 08:02 AM

Nicolasillo:

Are you now taking credit for my indicators? (scroll down to 4th chart).
http://www.traders-t...showtopic=86565


I don t think so. Btw I have shown this chart/indicator back at the end of 2007 & 2008 (and it went back to 1960s). I can t find the posts but the tt staff can find them and show them to you. I m not copying you!
I think I have the chart at home, i m at work now. I ll post it again for you. Oh, ask wavetimer which graph i m talking about cos he was asking what was it...on here and by pm.

#8 relax

relax

    Member

  • Traders-Talk User
  • 2,224 posts

Posted 08 January 2009 - 08:27 AM

spielchekr what are your eyes seeing at the moment any specific levels or time frame for what you are seeing thanks!

Edited by relax, 08 January 2009 - 08:30 AM.


#9 nicolasillo

nicolasillo

    Member

  • Traders-Talk User
  • 1,441 posts

Posted 08 January 2009 - 08:30 AM

spielchekr

that s one, i ll find the other one too.

http://www.traders-t...showtopic=81968

#10 TMN

TMN

    Member

  • Traders-Talk User
  • 1,174 posts

Posted 08 January 2009 - 08:52 AM

check my spiel buddy!