Jump to content


Photo

AAII All Time Record 70% Bearish


  • Please log in to reply
28 replies to this topic

#11 tomterrific14

tomterrific14

    Member

  • Traders-Talk User
  • 1,451 posts

Posted 07 March 2009 - 07:56 PM

Don, I am conflicted by the high readings.
I'm looking for a change but it sure seems like a volume climax needs to be seen... or else forgedaboudit.

I agree Roger, and that's what I meant when I said that perhaps the most profitable part of the decline (for short sellers) yet lies ahead of us. But I'll let the market tell it's story any way it want to... :unsure:


For us countertrend traders, we hope we catch the undertow of those tusanami waves crashes to shore....in other words , in playing musical chairs, that we find a seat before thee the music stops...............no extreme readings in indcarors will matter when it crashes to shore.....think Country defaults and European Banks...............

#12 denleo

denleo

    Member

  • Chartist
  • 3,097 posts

Posted 07 March 2009 - 08:14 PM

IYB, you have pretty much summariezed my thoughts in your post. It is impossible to say if we are at a bottom or not, but the probability is high that a bottoming process is about to begin. One more note: I read a lot lately about COTs and how bearish they are. Take a look at COTs at October 2007 all time high - the picture was the exact opposite of today. My next trade is most likely going to be on the long side. I will post it if and when I find an entry (hopefully at lower levels). Denleo

#13 IYB

IYB

    Member

  • TT Patron+
  • 7,145 posts

Posted 07 March 2009 - 08:30 PM

One more note: I read a lot lately about COTs and how bearish they are. Take a look at COTs at October 2007 all time high - the picture was the exact opposite of today.

I, too, made that exact observation here last month....thanks, Denleo.

Edited by IYB, 07 March 2009 - 08:37 PM.

“Men, it has been well said, think in herds; it will be seen that they go mad in herds, while they only recover their senses slowly, one by one.” Charles Mackay, Extraordinary Popular Delusions and the Madness of Crowds

#14 sjj

sjj

    Member

  • Traders-Talk User
  • 683 posts

Posted 07 March 2009 - 08:58 PM

Certainly not TA, but I can't overlook that the TV economist have in general recently switched their advise from "ride this market out" to "get out all or in part". I just can't dismiss my experience that just as soon as the general advise is to get out - its actually time to get in.

Edited by sjj, 07 March 2009 - 08:59 PM.


You can't be a beacon if your light don't shine !


#15 salsabob

salsabob

    Member

  • Traders-Talk User
  • 1,164 posts

Posted 07 March 2009 - 10:24 PM

Why we stay in the game.

Note during the Great Depression -

Posted Image

The 50% return within 3 months during the 1932 rally

The 100% return within 4.4 months during the 1933 rally

The 100% return within 24 months from early '35 to early '37 rally.

Stay nimble, but watch those downdrafts :rolleyes:
John Galt shrugged, outsourced to Red China and opened a hedge fund for unregulated securitized credit derivatives.

If the world didn't suck, wouldn't we all just fly off?

#16 humble1

humble1

    Member

  • Traders-Talk User
  • 5,959 posts

Posted 08 March 2009 - 12:35 AM

salsa: i'm so glad someone else is noticing the 1933 rally, which was four 19 year cycles* ago. i have a chart of 1933 but can't post it. looking closely at your chart here you can see we are right in the 1933 lift-off window. thanks to IYB for initiating this interesting thread. there are other analogies to 1933 which i have posted previously, many of which are obvious. * the 19 year is a solar/lunar cycle discovered by the greeks, also known as the metonic. four ninteen year cycles are an even more accurate 76 year cycle known as the callipic.

#17 NAV

NAV

    Member

  • Traders-Talk User
  • 16,087 posts

Posted 08 March 2009 - 09:48 AM

But here's the catch. Just like with sentiment, the divergences alone don't tell us when the move will begin. Will it start from here? Or 5% down? or 25% down? or more? We can't know.


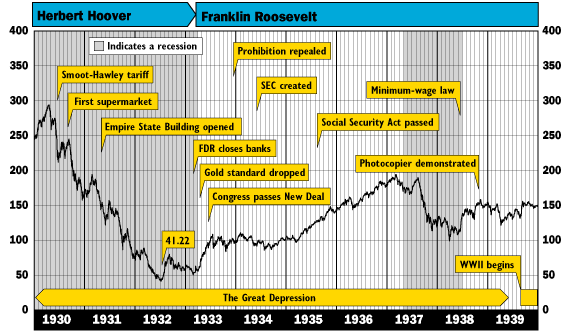
Exactly. The second leg (or the last leg ) of the bear market is often characterized by persistent divergence and price declines. If one looks at the 1929 decline, after the market broke the first leg lows, it was a story of decline and divergent bottom day after day until folks realized that they ran out of money to buy the market or were psychologically worn out. The market had lost 90% before it was all said and done. I am not saying that we are witnessing the same here. But the current violence in the market has only one historical precedent in the last 100 years, which is the 30s bear market. So i woudn't rule out anything here as to how low we could go before we can spring from the visible divergences on the chart. It's a dangerous game both financially and psychologically to play the divergences in my opinion. I don't know if Friday was the low or if are going to go down another 3-6 months before we make a low. But it will be unmistakable on the charts when the low comes in. Until then, short the pop, cover the oversold !

In fact, often the very best part of a trend occurs in just the last couple of days of that trend before it changes- implying that possibly the biggest trading profits from the short side still lie ahead.


I totally agree on that. But it's also the psychologically most difficult part to play.


Best

"It's not the knowing that is difficult, but the doing"


https://twitter.com/Trader_NAV


#18 NAV

NAV

    Member

  • Traders-Talk User
  • 16,087 posts

Posted 08 March 2009 - 09:59 AM

Why we stay in the game.

Note during the Great Depression -

Posted Image

The 50% return within 3 months during the 1932 rally

The 100% return within 4.4 months during the 1933 rally

The 100% return within 24 months from early '35 to early '37 rally.

Stay nimble, but watch those downdrafts :rolleyes:


salsabob,

With all due respect, do not confuse charts with trading. If one flips thru the pages of the history, the most astute traders of that time were broke before those spectacular rallies in the market begun in the 30s. "Plungers and Peacocks" is a nice read on the history of that era. Today we have an army of retails suckers and value buyers, who think they will catch those bottoms. Either the information age has transformed the markets or history will repeat itself. We should know that soon.

"It's not the knowing that is difficult, but the doing"


https://twitter.com/Trader_NAV


#19 humble1

humble1

    Member

  • Traders-Talk User
  • 5,959 posts

Posted 08 March 2009 - 11:45 AM

with an equal amount of due respect: we are seeing now an example of those who doubted america and lost. it happened then; it will happen now!

#20 Rich

Rich

    Member

  • Traders-Talk User
  • 761 posts

Posted 08 March 2009 - 01:03 PM

Why we stay in the game.

Note during the Great Depression -

Posted Image

The 50% return within 3 months during the 1932 rally

The 100% return within 4.4 months during the 1933 rally

The 100% return within 24 months from early '35 to early '37 rally.

Stay nimble, but watch those downdrafts :rolleyes:


So where are we now on this chart? It looks to me like we are half way through the Hoover period where the market dropped about 50 percent. We still have some distance down to travel before the bottom.

Rich