Edited by SilentOne, 02 September 2009 - 10:04 AM.

GDX - TA
Started by
Mike
, Sep 01 2009 02:28 PM
29 replies to this topic
#11

SilentOne
-

- Traders-Talk User
- 3,452 posts
Member
Posted 02 September 2009 - 10:03 AM
wxman,
The action this last week is probaby going to confirm it. There will still be a correction late into yearend, but I have to start staying with this sector if it a long term bull is confirmed.
cheers,
john
P.S. Long a partial position in GDX @ 39.70 from yesterday and ABX @ 40.20 CDN this morning.
"By the Law of Periodical Repetition, everything which has happened once must happen again and again and again-and not capriciously, but at regular periods, and each thing in its own period, not another's, and each obeying its own law ..." - Mark Twain
#12
skott
-

- Traders-Talk User
- 4,712 posts
Member
Posted 02 September 2009 - 10:32 AM
Mike, how do you post a chart with annotations that remains dynamic, i.e, updates periodically with the current price?
#13
Mike
-
- Traders-Talk User
- 389 posts
Member
Posted 02 September 2009 - 11:00 AM
Mike, how do you post a chart with annotations that remains dynamic, i.e, updates periodically with the current price?
Skott, if you're a paid member of stockcharts.com, when you pull up a chart there is a link that gives you a "Message Board Link." When you copy that link and post it here, you then have to modify the beginning and end of it before it will post. If you're with me so far, send me a private message and I'll walk you through the remainder.
-MK
#14
wxman
-

- Traders-Talk User
- 139 posts
Member
Posted 02 September 2009 - 11:17 AM
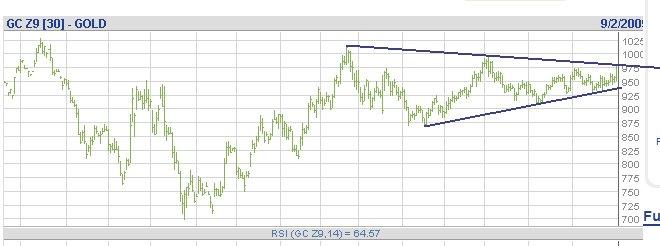
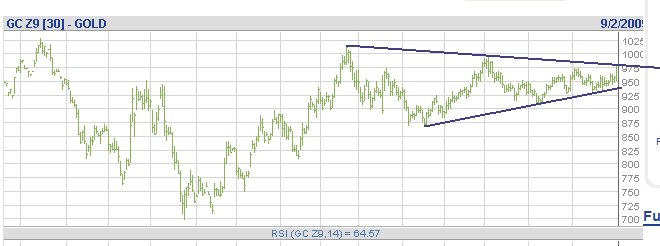
http://www.traders-t...mp;#entry479707
Aug 25 2009, 12:53 PM
I'm sticking with this 8 year cycle
http://stockcharts.com/h-sc/ui?s=$GOL...0&listNum=1
http://stockcharts.com/h-sc/ui?s=$GOL...0&listNum=1
and this count
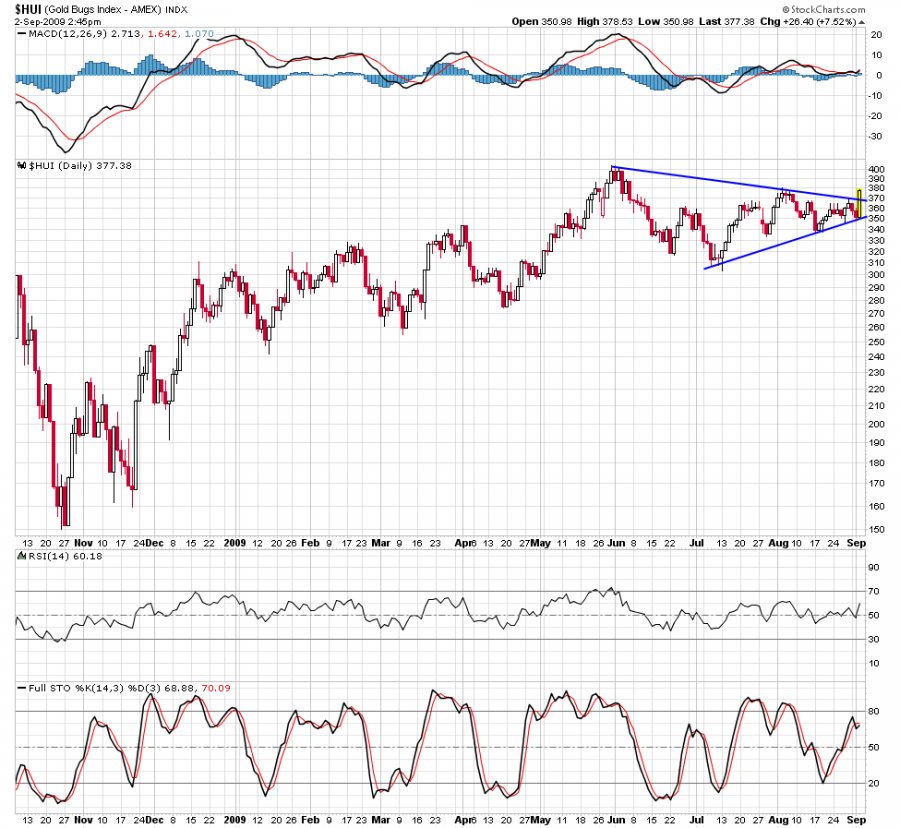
http://stockcharts.com/h-sc/ui?s=$XAU...amp;a=150423074
#15
skott
-
- Traders-Talk User
- 4,712 posts
Member
Posted 02 September 2009 - 11:53 AM
Mike, how do you post a chart with annotations that remains dynamic, i.e, updates periodically with the current price?
Skott, if you're a paid member of stockcharts.com, when you pull up a chart there is a link that gives you a "Message Board Link." When you copy that link and post it here, you then have to modify the beginning and end of it before it will post. If you're with me so far, send me a private message and I'll walk you through the remainder.
-MK
Ok, Mike when I get a chance I will check it out. thanks
#16
skott
-
- Traders-Talk User
- 4,712 posts
Member
Posted 02 September 2009 - 12:52 PM
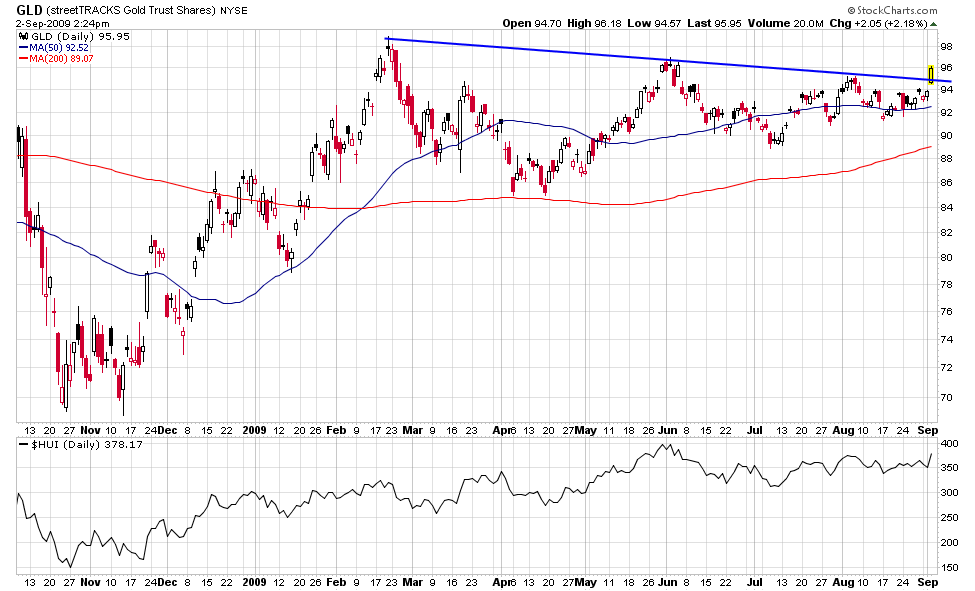
Silentone, since we have now broken out what is your target for the high before we turn down into your good buy point in the fall?
#17
gvc
-

- Traders-Talk User
- 409 posts
Member
Posted 02 September 2009 - 01:02 PM
sorry.. I dont see a breakout. I only see a touch of the upper triangle trendline.
#18
dougie
-

- Traders-Talk User
- 9,057 posts
Member
Posted 02 September 2009 - 01:36 PM
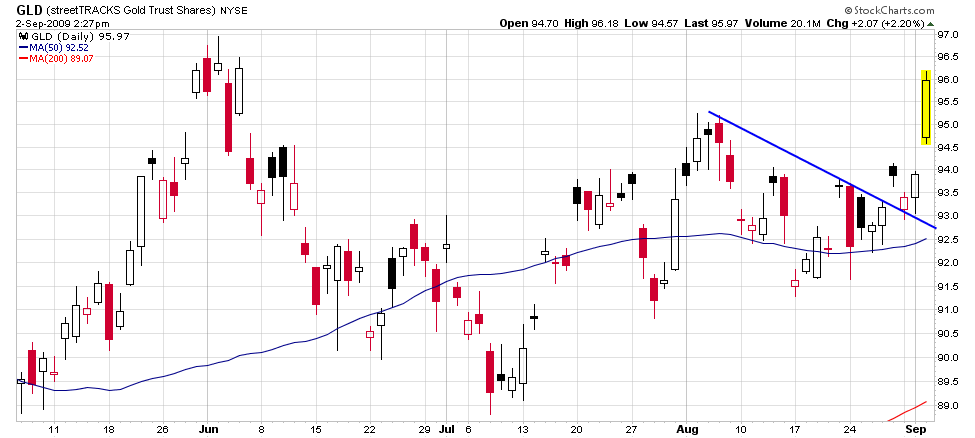
SLV has broken out
#19
Mike
-
- Traders-Talk User
- 389 posts
Member
Posted 02 September 2009 - 01:40 PM
sorry.. I dont see a breakout. I only see a touch of the upper triangle trendline.
I believe the breakout he is referring to is that in the GDX, the chart in the first post in this thread.
-MK
#20
skott
-
- Traders-Talk User
- 4,712 posts
Member
Posted 02 September 2009 - 01:47 PM
is your name also silentone? maybe this chart will help you
 or this one?
 or this one?
 or this one?
 or this one?


