I don't think we close up that much today. If not down. Today's open was a fakeout of all fakeouts. Great shorting opportunity. IMO.It's odd that oil can't get back above $80, if reflation is the theme.
Check GS, it barely moved.....

Member

Posted 23 November 2009 - 02:54 PM
I don't think we close up that much today. If not down. Today's open was a fakeout of all fakeouts. Great shorting opportunity. IMO.It's odd that oil can't get back above $80, if reflation is the theme.
Member

Posted 23 November 2009 - 02:59 PM
as per the 517/520 area I mentioned last week when I posted this chart...it's a key zone (2004 lows)...I have to say a daily close above 520 would be bullish...but I'd really like to see the monthly bar close above there for confirmation...
http://stockcharts.com/c-sc/sc?s=$OEX&p=M&yr=20&mn=11&dy=30&i=p81073908466&a=71542656&r=8811.png
Member

Posted 23 November 2009 - 04:08 PM
eminimee,
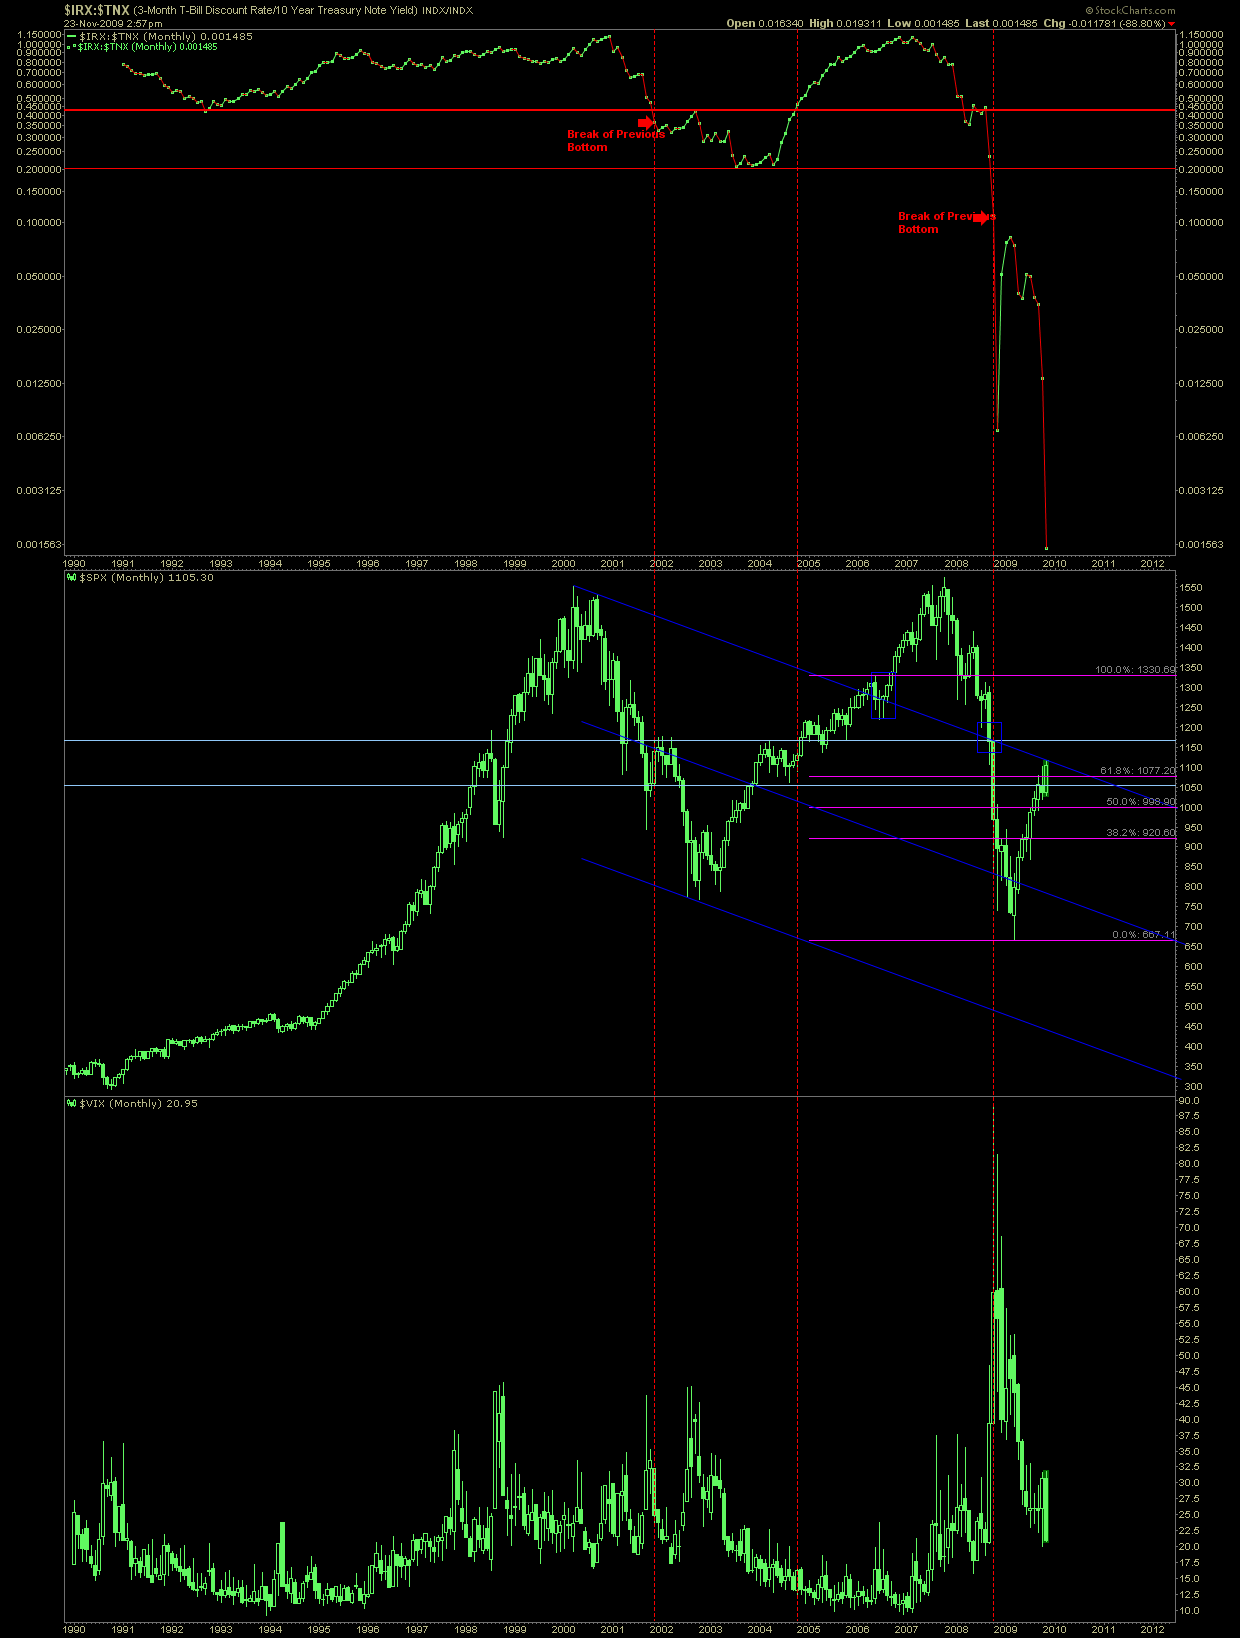
I like this chart.....I posted something similar for spx here http://www.traders-t...mp;#entry493849
and here is the update
as per the 517/520 area I mentioned last week when I posted this chart...it's a key zone (2004 lows)...I have to say a daily close above 520 would be bullish...but I'd really like to see the monthly bar close above there for confirmation...
http://stockcharts.com/c-sc/sc?s=$OEX&p=M&yr=20&mn=11&dy=30&i=p81073908466&a=71542656&r=8811.png
Member
Posted 23 November 2009 - 09:40 PM
Edited by NAV, 23 November 2009 - 09:49 PM.


