Jump to content


Photo

C'mOn Man


  • Please log in to reply
24 replies to this topic

#21 andr99

andr99

    Member

  • Traders-Talk User
  • 7,456 posts

Posted 09 January 2010 - 11:49 AM

Based solely on what we see here, what is (has been) the best viable trade?
Trading on the short side.

Does it continue to be an active strategy?
Yes. It would help to know if the spread between Price and 200ema is at historic highs.

When would be time to reduce our exposure and look for a long entry?
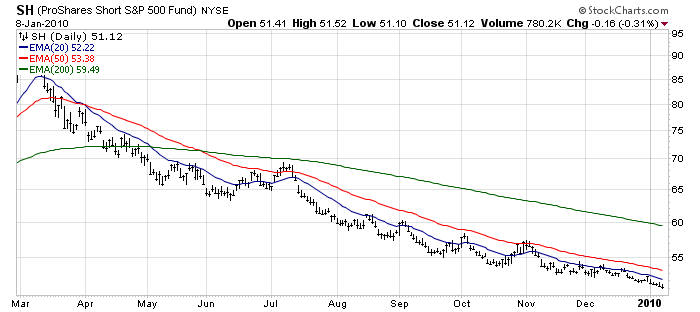
First step, Price trades above 50ema for more than a week.
Second step, 20 ema crosses above 50 ema.
Third step, Price crosses above 200ema.
Fourth step, 20ema crosses above 200ema.
Fifth step, 50ema also crosses above 200ema.

When does one trend end and a new one begin?
When the ema configuration fully reverses. Bullish configuration is with 20ema above 50 ema which is above 200ema. Bearish configuration is with 20ema under 50ema which is under the 200 ema. By this definition the bottom of the decline and the top of the climb is only known in hindsight. Ain't that usually the case anyway!

Excellent work Doc. Thank you for taking the time in helping with this exercise.

I'm sorry that "andr99" decided not to participate (and I am more than just a moving average trader...this was just an exercise).

Based on the strategy given by "andr99", the bottom line for something like this to be successful is knowing whether a trade will move in your favor or not...when the odds increase the likelihood that for your strategy will become a profitable one. As Doc points out, there's a lot that must happen before one can go with the kind of strategy that "andr99" presented above. As these "steps" unfold, not only will your chances of success increase as the market moves in your desired direction, each step provides another strategy that one must take to get their same objective. Markets just don't ring a bell and say "That's It!" (especially when it comes to stocks which tend to have rounding tops and spike bottoms). It's a slow, deliberate process despite the instant gratification that many look for these days. In this business, if the train is going from Los Angeles to New York, all we really want to do is get on in Las Vegas and get off in Philadelphia....to be on the train for the majority of the ride. More importantly, we need to also make sure that the train we're getting on is the right one and not the one going back to Los Angeles which would defeat the purpose of buying your ticket in the first place.

Going back to the chart for a moment, I presented this simple exercise to point out that there have been several times over the last 9 months when one could had traded "the initial drop that tells me the march rally is over" and this failed to go as planned. Each time the exponential moving averages were tested, the predominate trend held in place to the chagrin of many. With many continuing to be frustrated of when or where this might actually have the chance to occur, I thought this was a good place to add to the spirit to which the title of the thread conveys.

I fully understand that everyone here wants to enter a trade and be right as far as their timing. Nothing is better than immediate satisfaction and its possible acknowledgment by others. But without knowing which mood (friendly or hostile) the market is in to compliment an analytical opinion, your likely to be wrong more times than either your trading account or ego is likely to tolerate.

OK...here's the chart again with the symbol. For those who recognized it was SH, a gold star for you!

Fib

Posted Image


Based on the strategy given by "andr99", the bottom line for something like this to be successful is knowing whether a trade will move in your favor or not...when the odds increase the likelihood that for your strategy will become a profitable one..............................


You have understood nothing about my strategy. First of all I' m trying to see if indexes have reached or not important resistances. Second I try to look at divergences in some indicators I follow. Third and most important I try to understand if the march rally is corrective of the drop since 2008 or instead it is a new bull rally. IF it is corrective as I think, but I have no will to explain you why (not just me all around thinking it is corrective to say the truth), IF the indexes are at important resistances, IF there are absurd divergences in the indicators I follow..............well something is wrong with this rally. Does that mean I have to enter short at the first 2% drop ? No SIR. It means to me to be alerted and take a careful look at the nature of the rebound as soon as the indexes make a consistent drop. The nature of the rebound says it all about the nature of this march rally.

forever and only a V-E-N-E-T-K-E-N - langbard


#22 mss

mss

    I'M WATCHING

  • TT Sponsor
  • 6,182 posts

Posted 09 January 2010 - 12:21 PM

Based solely on what we see here, what is (has been) the best viable trade?

Does it continue to be an active strategy?

When would be time to reduce our exposure and look for a long entry?

When does one trend end and a new one begin?

Fib


The correct answers have already been given, therefore no reason to "beat a dead horse."
I would like to offer one of several ways a trader might improve their chance of timing/success, in when to change directions.
This by no means is 100% "fool-proof."

In the chart below there are a set of EMA's which would follow the same basic rules as outlined in ECHO's post.

There is also a block of momentum MACDS which indicate that the trend for this item (SH) is down and only in one place has appeared an alert to a potential trend change. Notice at the very top left, warnings of the down trend was quick and effective.


MA or EMA properly used are very effective in trading along with other indicators.

KEY:PRICE ALWAYS RULES - REGARDLESS

mss
WOMEN & CATS WILL DO AS THEY PLEASE, AND MEN & DOGS SHOULD GET USED TO THE IDEA.
A DOG ALWAYS OFFERS UNCONDITIONAL LOVE. CATS HAVE TO THINK ABOUT IT!!

#23 andr99

andr99

    Member

  • Traders-Talk User
  • 7,456 posts

Posted 09 January 2010 - 12:39 PM

Based solely on what we see here, what is (has been) the best viable trade?

Does it continue to be an active strategy?

When would be time to reduce our exposure and look for a long entry?

When does one trend end and a new one begin?

Fib


The correct answers have already been given, therefore no reason to "beat a dead horse."
I would like to offer one of several ways a trader might improve their chance of timing/success, in when to change directions.
This by no means is 100% "fool-proof."

In the chart below there are a set of EMA's which would follow the same basic rules as outlined in ECHO's post.

There is also a block of momentum MACDS which indicate that the trend for this item (SH) is down and only in one place has appeared an alert to a potential trend change. Notice at the very top left, warnings of the down trend was quick and effective.


MA or EMA properly used are very effective in trading along with other indicators.

KEY:PRICE ALWAYS RULES - REGARDLESS

mss

I repeat it .........if you are happy with your ma system...............go on with it. I look at something different. Do you think nothing else exist worth to be adopted ?

forever and only a V-E-N-E-T-K-E-N - langbard


#24 Echo

Echo

    Member

  • Traders-Talk User
  • 2,273 posts

Posted 09 January 2010 - 12:52 PM

Andr99,

If you break it down, there are 2 types of trading philosophies using strictly technical analysis. I will call them followers and predictors. Followers look at the chart as it stands up to the hard right edge and employ some very simple analysis to decide if the trend is still intact and follow it till it isn't. Stuff like the ema's in the above example as Scott has so successfullly used, simple trendlines or channels as Gary Smith has so successfully used, simple accumlation/distribution methods employed by IBD as Charles has so successfully used, or simply a chart that is moving from the lower left corner towards the upper right. You should be able to throw the chart up in front of a child and ask is this going up or down and get an answer in under 1.618 seconds. Followers get on the train from LA to NY in Las Vegas, sometimes even El Paso if the incoming train looked unusually dilapidated.

Now the other philosophy using TA is the predictors. This is a lot more fun and challenging. This is the stuff some live for. This is the stuff of maximizing profits on the train which we know in the real world zigzags across the country and doesn't move in a straight line and sometimes backtraces quite a bit. This is the stuff that can be as challenging as rocket science for the intellectual. This is the stuff that can be as addicting as smoking and gambling. This is where the trader uses indicators, S/R lines, volume, breadth, e-wave, Hurst, Gann, astro, fan lines, divergences, intermarket interactions, liquidity, and a million other things to predict entries and exits that will be the return of the followers. If you can't beat the return of the followers, than why bother, other than perhaps the thought that if you do it long enough, you'll get better and perhaps in the future be able to beat the followers. You should also factor in the commissions of all the in/out trades and the time of your life spent in this pursuit, time the followers have doing anything else they want to. Time is precious. How much is an hour of your time worth? How much are thousands of hours? Throw in extra cost if you stay up late at night or through the night and get insufficient sleep, we know that can cost your long term health. That said, many people do this or strive to do this. Some do it very well, good enough for day trading. Others do it for swing trades. The point here is that the market is going to continue to do what it does regardless of what all the TA says it should do. Larry has presented excellent analysis along the way why SPX 875 should be the IT top and then all the way up from 875, various other tops were suggested by the technique. First 0.618, then 0.75 or more, then 1.0, then 1.61 and then even 2.6 (correct me if I got the number wrong) extensions. Larry wasn't wrong. His analysis was very well thought out and documented. It is just that things that worked in the past might not work every time and this drop in 07-09 was unique and so severe that the reaction and liquidity thrown at it is causing and equally unique and exuberant recovery.

Many are saying the exuberance of the recovery is illogical and doesn't make sense and we all know the saying the the market can remain illogical longer than you can remain solvent fighting it. In Q1 2009 when the markets started plunging again into the March lows and Citi dropped below 1 and BAC below 3, etc and the world looked like it was out of control falling apart, the situation was so drastic that unprecedented liquidity was thrown at it all around the world. The stock market gains from that liquidity injection may not be any more predictable as to its exact extent anymore than the drop into March was.

So maybe best to mix the 2 techniques and use the follower method for the core money and then to have some play money for the exciting predicting methods. Nothing feels better for a trader than to nail the bottom or the top...

Doc

#25 maineman

maineman

    maineman

  • Traders-Talk User
  • 1,987 posts

Posted 09 January 2010 - 12:54 PM

Moving averages are essential to trading. They set the picture. For the big picture or, at least, the intermediate term. When the EMA 10 > 55 you can safely trade long. You can either buy and hold, depending on the market, or use this fact to plan long scalps. Longer term MAs, like the 200 dma are useful for fund managers and investors more than for traders. I'm not sure they're so helpful on a minute to minute time frame due to the lag of the indicator and the high speed of the large institutions who can out trade you any day. I have successfully used a 5 x 9 ma on 1 or 2 min charts but only for scalping for nickels and only in the context of the bigger picture, along with much more reliable chart patterns (triangle, support and resistance lines, etc). In one of the best books on trading ever written, "Pit Bull" Marty says something like this: if the EMA 10 >55 you better have a pretty darn good explanation for why you are going short. mm
He who laughs laughs laughs laughs.

My Blog -Maineman Market Advice