Jump to content


Photo

IN CYCLES WE TRUST


  • Please log in to reply
42 replies to this topic

#31 fib_1618

fib_1618

    Member

  • Traders-Talk User
  • 10,145 posts

Posted 16 May 2010 - 07:56 PM

The correct analogy is that their is 1 fuel source[liquidity] and 10 cars [ all markets, retail, etc].

What you've described is something out of the Ivy League fundamental understanding of economics and has little to do with how prices move based on direct stimulative technical forces. When it comes to equities, there is only one source of fuel as there would be with a single pipeline. This single pipe line is a cumulative total of various bypasses and tributaries that are fed into this pipeline as it travels like a river through the financial system. Because of this, stimulative effects, such as those you've described, take quite a bit of time to be "refined" before this fuel quotient is able to be put to work. It is not immediate. The total availability and combustion rate of this same energy that drives the directional engine of stock prices is what the advance/decline line provides.

we had price diverging with internals in 02

No...what you had was the NYUD data moving in lock step with the higher weighted high cap stocks that drive the better known indices (those they are the last to join the party in either direction), while the broader market had already bottomed (with the help of Y2K). This allowed enough buoyancy where the amplitude difference between the SPX, SML and MID price structures was remarkable during the 2002-2007 period (and why the small and mid caps were able to move to new all time highs first after the 2002-2003 lows).

Fib

Better to ignore me than abhor me.

“Wise men don't need advice. Fools won't take it” - Benjamin Franklin


"Beware of false knowledge; it is more dangerous than ignorance" - George Bernard Shaw


Demagogue: A leader who makes use of popular prejudices, false claims and promises in order to gain power.

Technical Watch Subscriptions


#32 CLK

CLK

    Member

  • Traders-Talk User
  • 10,787 posts

Posted 16 May 2010 - 08:07 PM

The correct analogy is that their is 1 fuel source[liquidity] and 10 cars [ all markets, retail, etc].

What you've described is something out of the Ivy League fundamental understanding of economics and has little to do with how prices move based on direct stimulative technical forces. When it comes to equities, there is only one source of fuel as there would be with a single pipeline. This single pipe line is a cumulative total of various bypasses and tributaries that are fed into this pipeline as it travels like a river through the financial system. Because of this, stimulative effects, such as those you've described, take quite a bit of time to be "refined" before this fuel quotient is able to be put to work. It is not immediate. The total availability and combustion rate of this same energy that drives the directional engine of stock prices is what the advance/decline line provides.

we had price diverging with internals in 02

No...what you had was the NYUD data moving in lock step with the higher weighted high cap stocks that drive the better known indices (those they are the last to join the party in either direction), while the broader market had already bottomed (with the help of Y2K). This allowed enough buoyancy where the amplitude difference between the SPX, SML and MID price structures was remarkable during the 2002-2007 period (and why the small and mid caps were able to move to new all time highs first after the 2002-2003 lows).

Fib


I don't doubt what will happen out of a divergent bottom,
I just don't think we are anywhere close to that yet.
Looking for new bear market lows.

#33 fib_1618

fib_1618

    Member

  • Traders-Talk User
  • 10,145 posts

Posted 16 May 2010 - 08:53 PM

Looking for new bear market lows

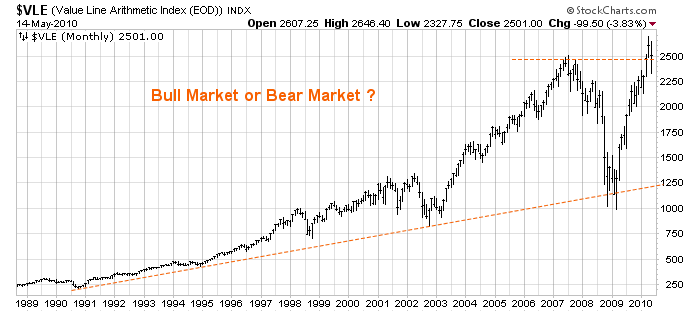
How do you define a bear market?

Fib

Better to ignore me than abhor me.

“Wise men don't need advice. Fools won't take it” - Benjamin Franklin


"Beware of false knowledge; it is more dangerous than ignorance" - George Bernard Shaw


Demagogue: A leader who makes use of popular prejudices, false claims and promises in order to gain power.

Technical Watch Subscriptions


#34 BigBadBear

BigBadBear

    Member

  • Traders-Talk User
  • 1,007 posts

Posted 16 May 2010 - 09:17 PM

"What you've described is something out of the Ivy League fundamental understanding of economics and has little to do with how prices move based on direct stimulative technical forces. When it comes to equities, there is only one source of fuel as there would be with a single pipeline. This single pipe line is a cumulative total of various bypasses and tributaries that are fed into this pipeline as it travels like a river through the financial system. " well Prof, thats where we part company. That statement is something you could read in a Krugman or Stephenson text book in any University in the world whether Oxford or Princeton. When my Phd thesis is over I will publish online and it will not be a shock to many as anyone with a Msc in Economics knows that your paragraph above simply does not fit in the real world but fits well within standard econometric modeling. And again lets keep it simple. THE MONEY MULIPLIER IS STILL BELOW 1. Do you even understand what that means Your fuel is having a negative cumulative effect.. it really that simple and now the Federal reserve economic reports acknowledge the simple fact. I think you are going to be very surprised Fib, very very surprised

#35 voltaire

voltaire

    Member

  • Traders-Talk User
  • 1,134 posts

Posted 16 May 2010 - 11:40 PM

voltaire do you have a link to aussie futures

thanks


This will give you 20 min delayed.

"comp" includes night session.

You can select "day" from the list.


http://futuresource....art...BRSI(14);

#36 CLK

CLK

    Member

  • Traders-Talk User
  • 10,787 posts

Posted 17 May 2010 - 04:28 AM

Looking for new bear market lows

How do you define a bear market?

Fib


This was a primary bull within a secular bear.

#37 Echo

Echo

    Member

  • Traders-Talk User
  • 2,273 posts

Posted 17 May 2010 - 08:40 AM

The Aussie market which I trade...made its high on April 15th.

Just for the sake of clarity....although the nominal price highs did come on April 15th 2010, the orthodox internal highs of the Aussie Market came October 21, 2009. This high point, and the beginning of their bear market, was later confirmed on November 19th when liquidity levels dried up completely because of monetary policy by the Reserve Bank of Australia. On the other hand, US monetary policy remains quite aggressive in this area of analysis, so we should see higher price highs in the SPX before all is said and done...each marketplace should be traded accordingly.

Fib


Is there anywhere you can see an AD line for the Aussie market? Thx.

#38 dw85745

dw85745

    Member

  • Traders-Talk User
  • 161 posts

Posted 17 May 2010 - 02:09 PM

Economics and all the degrees in the world don't really help you in trading. My most favorite quote regarding this is: The only function of economic forecasting is to make astrology look respectable. John Kenneth Galbraith.

#39 fib_1618

fib_1618

    Member

  • Traders-Talk User
  • 10,145 posts

Posted 17 May 2010 - 02:55 PM

Is there anywhere you can see an AD line for the Aussie market?

It will be introduced sometime this week at Technical Watch.

The only function of economic forecasting is to make astrology look respectable. John Kenneth Galbraith.

I happen to like...

"An economist is someone who sees something happen, and then wonders if it would work in theory" - Ronald Reagan

This was a primary bull within a secular bear.

Is it?

Fib

Posted Image

Better to ignore me than abhor me.

“Wise men don't need advice. Fools won't take it” - Benjamin Franklin


"Beware of false knowledge; it is more dangerous than ignorance" - George Bernard Shaw


Demagogue: A leader who makes use of popular prejudices, false claims and promises in order to gain power.

Technical Watch Subscriptions


#40 Not Too Swift

Not Too Swift

    Member

  • Traders-Talk User
  • 2,089 posts

Posted 17 May 2010 - 05:58 PM

Is there anywhere you can see an AD line for the Aussie market?

It will be introduced sometime this week at Technical Watch.

The only function of economic forecasting is to make astrology look respectable. John Kenneth Galbraith.

I happen to like...

"An economist is someone who sees something happen, and then wonders if it would work in theory" - Ronald Reagan

This was a primary bull within a secular bear.

Is it?

Fib

Posted Image


Now we are back to why I believe you have to look at inflation adjusted plots.
I let the market tell me what to do. The trouble is she mumbles a lot, and I'm hard of hearing.

1576 ONO. Upside down, reverse, inside out, snort...