 I agree with your outlook and feel pretty dang lonely on the bull side lately. Welcome back Techman.

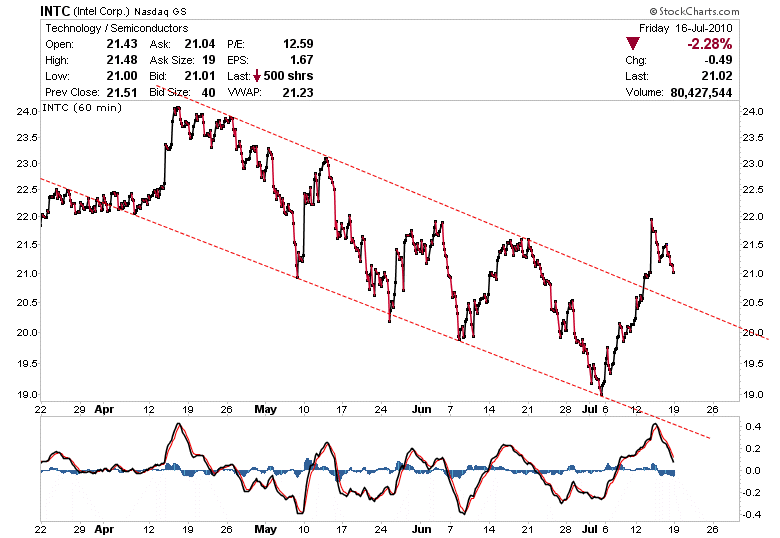
Bullish Falling Wedge Led by INTEL (INTC)
Started by
TechMan
, Jul 18 2010 03:20 PM
19 replies to this topic
#11
: post #11")
IYB
-

- TT Patron+
- 7,146 posts
Member
Posted 18 July 2010 - 06:23 PM
They say that "politics makes strange bedfellows". Well so does the market at times. I agree with your outlook and feel pretty dang lonely on the bull side lately. Welcome back Techman.
I agree with your outlook and feel pretty dang lonely on the bull side lately. Welcome back Techman.
Men, it has been well said, think in herds; it will be seen that they go mad in herds, while they only recover their senses slowly, one by one. ― Charles Mackay, Extraordinary Popular Delusions and the Madness of Crowds
#12
punter
-

- Traders-Talk User
- 1,899 posts
Member
Posted 18 July 2010 - 06:30 PM
Hey Barry - Worldwide Semi sales had gone up over 48% in May, comparing to the same month last year. On the monthly basis, it had surpassed the pre "Great Recession" highs. My source in China tole me that they couldn't find enough workers to make the products. As you know semiconductors are almost in everything nowadays. China's slowing down to 10.3%? They couldn't have enough luxury goods in stock for affluent Chinese consumers.
Semicon production hit the roof this year. the same factories are operating at max capacity in SG. Sg, GDP hit 14% this year partly because of SEMIcon and oil related exports.
Keep Calm and be Long
My opinion on markets, or anything, is a health hazard. Follow or fade at your own risk!
#13
TechMan
-
- Traders-Talk User
- 7,663 posts
Member
Posted 18 July 2010 - 06:51 PM
They say that "politics makes strange bedfellows". Well so does the market at times.
Hey IYB - Thanks. Feeling lonely on one side only means you're on the "right" side of the trade.
I'll try to check back in whenever I have the time to do so. That California primary had gotten me totally exhausted. Now, we're working hard toward the final destination, the November election. I'll never do this again. I hate politics.
Hi dTraderB - Thanks for the article. I've read that too. You may be right, as the market needs a breather after its nearly 9% advance from the July 1 low to the July 13 high all in just 7 sessions.
Good luck to ya...
#14
inamosa
-

- Traders-Talk User
- 1,638 posts
Patterns-based Trader and Investor in ETFs and Futures
Posted 18 July 2010 - 07:04 PM
They say that "politics makes strange bedfellows". Well so does the market at times.
Same here.
Thanks Techman.
"Our job is not to predict where the market will go, but to interpret daily price and volume action to ascertain the facts of the current environment and make decisions based on that interpretation."
-Scott O'Neil (son of William O'Neil), Portfolio Manager at ONeil Data Systems, when asked where the Dow would go in the coming months
-Scott O'Neil (son of William O'Neil), Portfolio Manager at ONeil Data Systems, when asked where the Dow would go in the coming months
#15
selecto
-

- Traders-Talk User
- 6,871 posts
Member
Posted 18 July 2010 - 07:09 PM
"I don't see converging lines when you draw them from the April-May peak. Too many of the troughs and peaks don't touch the lines in the above charts. Everybody sees H&S and wedges everywhere."

Edited by selecto, 18 July 2010 - 07:13 PM.
#16
TechMan
-
- Traders-Talk User
- 7,663 posts
Member
Posted 18 July 2010 - 07:09 PM
Hey goldswinger - Always good hearing from ya.
The FXY:FXE appear to be in a Double Top formation with negative divergence on most technical indicators on that 2nd top on the right. And the Dollar is at best in a neutral zone for now; it also hadn't had a strong correlation with the equity market since 2nd half of June.
As for the credit spread, the TED Spread is actually having a bullish divergence with the equity market. The TED Spread has been lower and subsequently going sideways since mid June. As far as the VIX, the VXN, and the QQV volatility indices are concerned, they've been in a box since early June.
The low trading volume tells me that most market participants are confused, and many of these indicators have actually been in a holding pattern. We're not alone.
#17
goldswinger
-

- Traders-Talk User
- 2,612 posts
Member
Posted 18 July 2010 - 07:19 PM
Hey goldswinger - Always good hearing from ya.
The FXY:FXE appear to be in a Double Top formation with negative divergence on most technical indicators on that 2nd top on the right. And the Dollar is at best in a neutral zone for now; it also hadn't had a strong correlation with the equity market since 2nd half of June.
As for the credit spread, the TED Spread is actually having a bullish divergence with the equity market. The TED Spread has been lower and subsequently going sideways since mid June. As far as the VIX, the VXN, and the QQV volatility indices are concerned, they've been in a box since early June.
The low trading volume tells me that most market participants are confused, and many of these indicators have actually been in a holding pattern. We're not alone.
Thx Techman, I can see your positioning and for now I have a small long position for Monday, with a bearish bias, maning I intend to short after a bounce and a subsequent turn on my short term indicators.
At the same time though, I can see how we could be just doing a correction of the move up from 1003, so I am prepared t go long when the proper + divergences show up on my 60 MIN chart.
I also see the PM sector moving higher after this GOLD drop completes likely Tomorrow...................
GS.
#18
TechMan
-
- Traders-Talk User
- 7,663 posts
Member
Posted 18 July 2010 - 07:21 PM
And, finally, the Open Interests of the VIX July 2010 options that are due to expire on Wednesday appear to be quite bullish as the Put volume remains overwhelmingly higher than the Call volume.
doesn't higher put volume on vix indicate bullishness and is therefore a contrary indicator???

Yes, high VIX options Put volume is a bullish indicator, particularly when it's located mostly to the left of the blue dotted line (the approx. current VIX value). By the same token, you can see how short the white bars (call volume) are on the right side of that line.
Here's an extra chart for ya. Below is the change of the VIX July 2010 Open Interests for Friday, 7-16-2010. As much as the market had sold off on Friday, the change in the OI from Thursday to Friday was actually quite insignificant - only by a couple thousand contracts here and there sporadically. It's obvious that the VIX options traders did not buy into the selloff on Friday.

O.K. that's really it for me. Again, have a great trading week ahead.
Edited by TechMan, 18 July 2010 - 07:22 PM.
#19
qqqqtrdr
-

- Traders-Talk User
- 3,221 posts
Member
Posted 18 July 2010 - 07:42 PM
Hey Barry - Worldwide Semi sales had gone up over 48% in May, comparing to the same month last year. On the monthly basis, it had surpassed the pre "Great Recession" highs. My source in China tole me that they couldn't find enough workers to make the products. As you know semiconductors are almost in everything nowadays. China's slowing down to 10.3%? They couldn't have enough luxury goods in stock for affluent Chinese consumers.
Semicon production hit the roof this year. the same factories are operating at max capacity in SG. Sg, GDP hit 14% this year partly because of SEMIcon and oil related exports.
I don't disagree with you on Semiconductor Sales so far since last May. I don't have my Semicondcutor job computer in front of me. Future growth of Semiconductor ranges from 16% - 26% over the next year... A year ago we hit bottom in Semiconductor.. In fact, I do have a long position in a Semiconductor stock at the moment... I'm just mentioning that in Semiconductor, the economics is quite volatile, and production can change quite fast... The economy starts to turn down, Semis will be hit also. Part of my negativity on NAS100 is not related to Semis, but the disjointed market cap on the index with 50% of the index in 7 high tech companies.
Barry
#20
andr99
-

- Traders-Talk User
- 7,447 posts
Member
Posted 18 July 2010 - 11:30 PM
patterns are not rocket science and experienced traders know that there are often different interpretations of the same chart.
No way to avoid mistakes in interpreting charts because of that. With regards to actual market, there's nothing bullish imo. I'm looking at all around and such things as apple, a market leader, the dax, an important index as it leads Europe, heavy stocks belonging to my own domestic market, are all pointing to a drop. Intel marked past year's july run up. Now that its earnings are out we are close to a market drop
forever and only a V-E-N-E-T-K-E-N - langbard


