
James Turk on KWN seems to believe something is happening.

bottoming
Started by
dharma
, May 17 2011 08:35 PM
179 replies to this topic
#142

stubaby
-

- Traders-Talk User
- 1,660 posts
Member
Posted 05 July 2011 - 09:58 PM
Interesting Charts (the weekly from inception esp  ) - recently added to this position - do your own DD
http://stockcharts.c...8699&r=4362.png
http://stockcharts.c...8714&r=1294.png
http://stockcharts.c...8761&r=4650.png
Evolving Gold
stubaby
) - recently added to this position - do your own DDhttp://stockcharts.c...8699&r=4362.png
http://stockcharts.c...8714&r=1294.png
http://stockcharts.c...8761&r=4650.png
Evolving Gold
stubaby
#143
dougie
-

- Traders-Talk User
- 9,058 posts
Member
Posted 06 July 2011 - 01:52 AM
why chart the pinks rather than the underlying vancouver Stu?
#144
dharma
-
- Traders-Talk User
- 9,618 posts
Member
Posted 06 July 2011 - 08:41 AM
here we are w/the next sovereign du jour in obvious trouble. portugal and greece are realatively small, wait till we get to spain, italy etc.
its amazing how the press focus ' the attention where they want to corral investors. back in the day, the obscure hunt family became a household name. invest w/the big boys- the hunts. buy silver. speaking of which put up a chart of silver going back to 80. 31 years of cause. silvers high in 80 was 52.5 it recently almost got to 50. this is one volatile hombre. corrected 30% + in a heart beat. not for the faint of heart. i didnt sell, although it was mighty tempting. but studying that 31year chart it all looked like it was building cause. notice that when gold hit its 80 high, it kept going . silver on the other hand suffered a severe correction. this is one volatile hombre. do not fall in love.
looks to me like this summer will not be quiet!
the press serves the needs of the banksters.
dharma
#145
tradermama
-

- Traders-Talk User
- 909 posts
Member
Posted 06 July 2011 - 10:25 AM
Hello Dharma,here we are w/the next sovereign du jour in obvious trouble. portugal and greece are realatively small, wait till we get to spain, italy etc.
its amazing how the press focus ' the attention where they want to corral investors. back in the day, the obscure hunt family became a household name. invest w/the big boys- the hunts. buy silver. speaking of which put up a chart of silver going back to 80. 31 years of cause. silvers high in 80 was 52.5 it recently almost got to 50. this is one volatile hombre. corrected 30% + in a heart beat. not for the faint of heart. i didnt sell, although it was mighty tempting. but studying that 31year chart it all looked like it was building cause. notice that when gold hit its 80 high, it kept going . silver on the other hand suffered a severe correction. this is one volatile hombre. do not fall in love.
looks to me like this summer will not be quiet!
the press serves the needs of the banksters.
dharma
Just chiming in here ...reminder Moon goes into Saggi on full moon July 14th...we just got a pnf (Point and Figure using Tom Dorsey's system) buy on gold/miners and some gold mutual funds that have been on a sell for a while..I like watching mutual fund action because that gives an idea of more of a basket of gold stocks directions...one which is usagx also has an intermediate buy which is stronger in direction upward. AGQ has a buy 1 and so far typically has been going up to 3 buy signals on pnf. But this could be a duplicate of last year with a low in for metals in July..no calling here..just observation. I've been in AGQ since last week's lows and riding it till proven otherwise. Good trading..
TM
#146
tradermama
-
- Traders-Talk User
- 909 posts
Member
Posted 06 July 2011 - 11:04 AM
Make that full moon July 15th..not the 14th
TM
#147
jabat
-

- Traders-Talk User
- 606 posts
Member
Posted 06 July 2011 - 11:48 AM
Here is a recent study by Quad G of Moon on Gold prices (13 months)
http://www.majormark...s.blogspot.com/
http://www.majormark...s.blogspot.com/
#148
tradermama
-
- Traders-Talk User
- 909 posts
Member
Posted 06 July 2011 - 01:10 PM
Typically, gold falls into the full moon but that might just be a few days prior to the full moon..we have jobs report Friday and that might give us a reason for a pullback but when we have a moon in Sagitarius ..we have a 60% of a sharp move up..20% mild up..20% down..Today i also got a point and figure buy on silver too...demand is taking over supply on metals/miners at this time..and a good chance the big indicator NYSE bullish percent reversed to X which would mean most likely new highs in the market..which could help bolster metals too as it has typically gone up with the market. I subscribe to Tom Dorsey's Point and Figure which is slightly different and more reliable than Stockchart's settings.Here is a recent study by Quad G of Moon on Gold prices (13 months)
http://www.majormark...s.blogspot.com/
Also, noting that the HUI and XAU has had a CHan buy signal with possibly closing over its 50 ema's...gld is close to a chan buy too and so is slv..but what I use including for the equities are certain mutual funds as a gauge and right you have userx and usagx just getting point and figure buy signals...
we'll see, but if the nyse bullish percent gets that X today, people wont believe we will be rallying further up..and it will be buy the dip..I would not be short if and when that indicator reverses to X. Point and Figure to me is more of a confirmation of trend and it keeps you on the right side of the fence even though there is other evidence of an intermediate uptrend. This would be a confirmation of it.
TM
#149
tradermama
-
- Traders-Talk User
- 909 posts
Member
Posted 06 July 2011 - 02:02 PM
Typically, gold falls into the full moon but that might just be a few days prior to the full moon..we have jobs report Friday and that might give us a reason for a pullback but when we have a moon in Sagitarius ..we have a 60% of a sharp move up..20% mild up..20% down..Today i also got a point and figure buy on silver too...demand is taking over supply on metals/miners at this time..and a good chance the big indicator NYSE bullish percent reversed to X which would mean most likely new highs in the market..which could help bolster metals too as it has typically gone up with the market. I subscribe to Tom Dorsey's Point and Figure which is slightly different and more reliable than Stockchart's settings.Here is a recent study by Quad G of Moon on Gold prices (13 months)
http://www.majormark...s.blogspot.com/
Also, noting that the HUI and XAU has had a CHan buy signal with possibly closing over its 50 ema's...gld is close to a chan buy too and so is slv..but what I use including for the equities are certain mutual funds as a gauge and right you have userx and usagx just getting point and figure buy signals...
we'll see, but if the nyse bullish percent gets that X today, people wont believe we will be rallying further up..and it will be buy the dip..I would not be short if and when that indicator reverses to X. Point and Figure to me is more of a confirmation of trend and it keeps you on the right side of the fence even though there is other evidence of an intermediate uptrend. This would be a confirmation of it.
TM
Just got a confirmation that they NYSE bullish percent now reversed to X according to Tom Dorsey's PNF site. This means more upside in equities and with the signals I got on miner/metals more upside there...most likely Friday is a pullback but pullbacks are dip buying now. This is not an indicator that flips back and forth a lot..it means we have a lot more demand in buying ....we retraced from an overbought as hi as around 84% in May to midway to 52% mid June..and now at 58%... anything over 70% is overbought so hi odds we challenge that at a minimum. Maybe next week we go down into the full moon or consolidate..in a range. I think you will see a lot of top callers soon...but this is not the top..not now!
#150
JGUITARSLIM
-

- Traders-Talk User
- 618 posts
Member
Posted 06 July 2011 - 02:47 PM
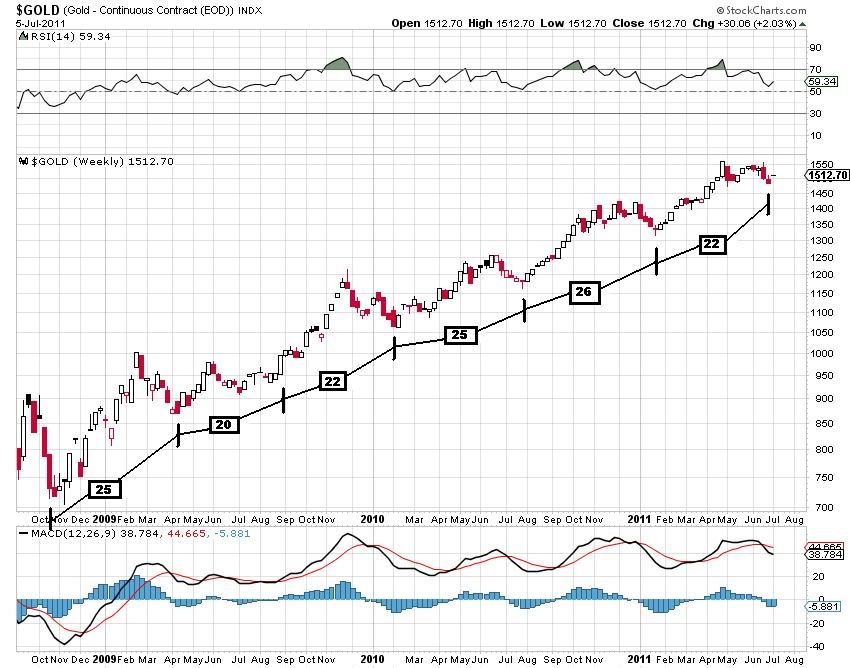
Update on IT weekly gold cycle. We are currently on week 23 of this cycle.
Historically 90% of these cycles bottom 23 weeks or shorter.
Note the last two cycles have been stretched.
Last weeks highs taken out. IMO, good chance we just saw a IT bottom on week 22.
Historically 90% of these cycles bottom 23 weeks or shorter.
Note the last two cycles have been stretched.
Last weeks highs taken out. IMO, good chance we just saw a IT bottom on week 22.


