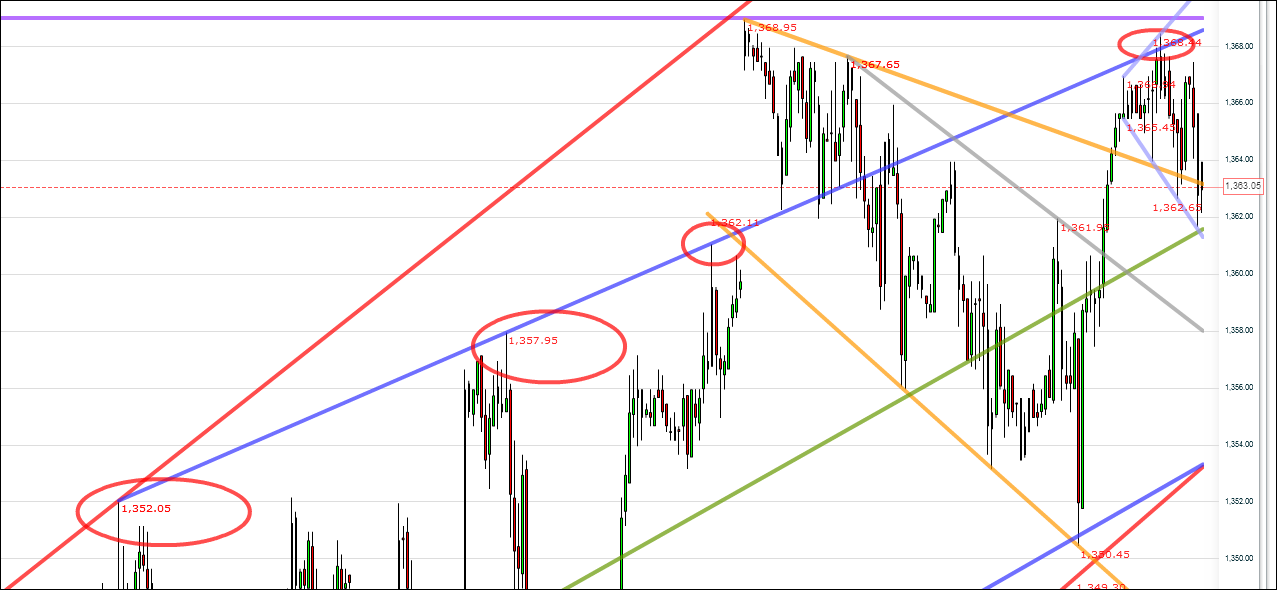
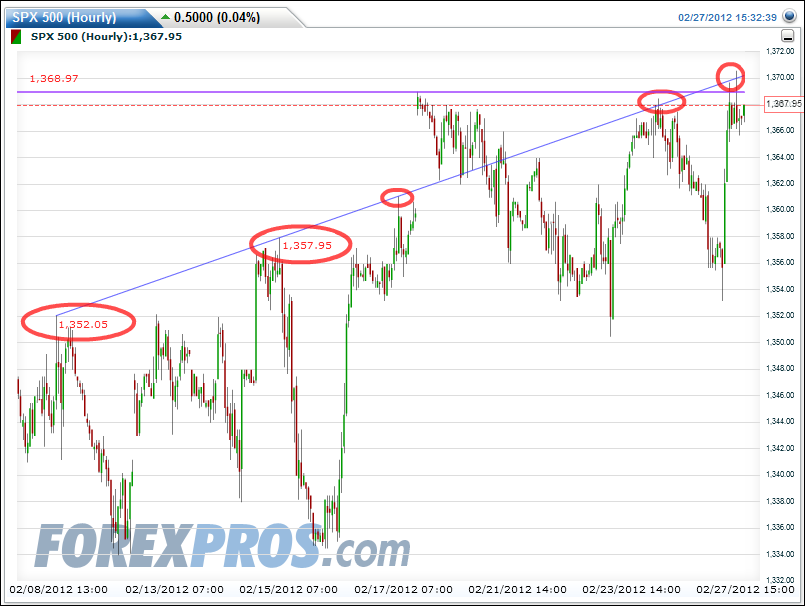
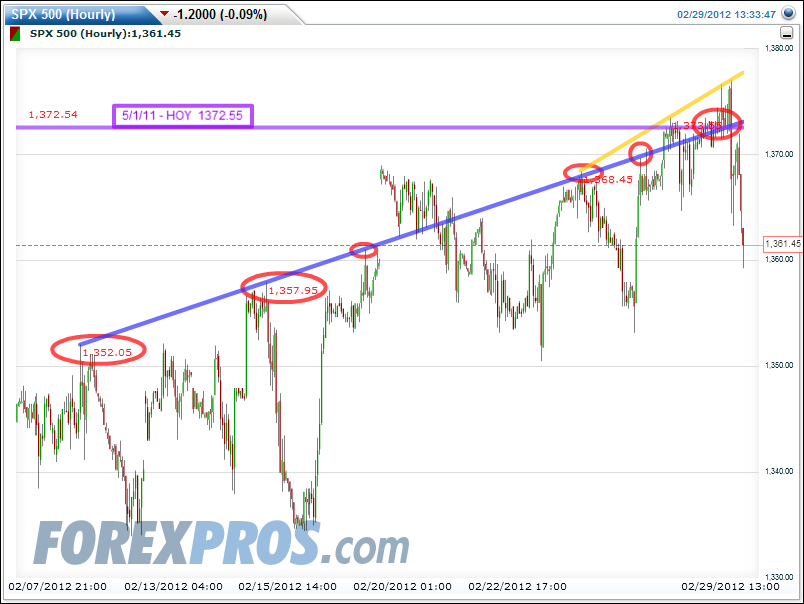
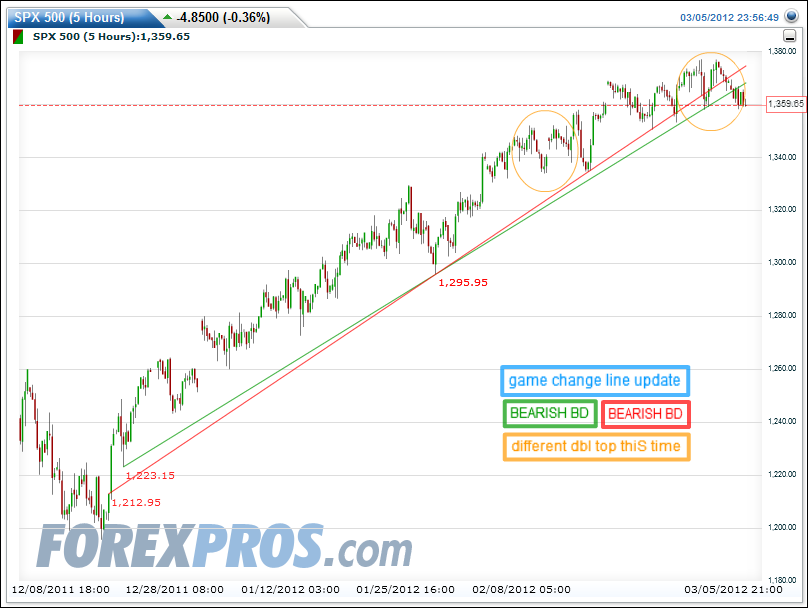
[2/9, 5 AM] = 1352.05 = first left red circle on BLUE lineES Hourly, draw 'trend line' ... connect [2/9 5am] and [2/15 4am], both HOD.
[2/15, 4 AM] = 1357.95 = 2nd left red circle on BLUE line
2/17 and today 2/24 HOD = 3rd and 4th red circle on BLUE line
All four HOD turned down on BLUE line created by quote
Pivotal: above BLUE line is Bullish; below Bearish.
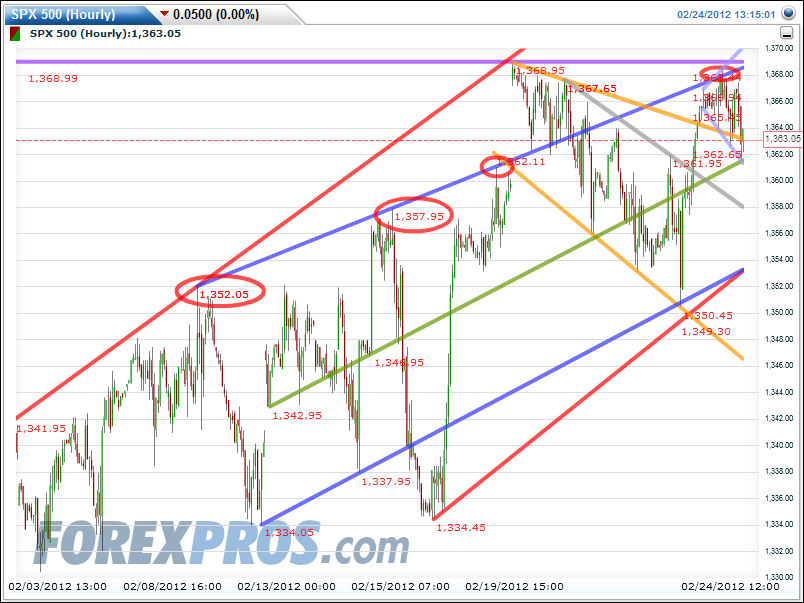
Same chart zoomed in on said BLUE line: