
Goldman Sachs Group, Inc.(NYSE:GS)
Started by
Costa
, Mar 18 2012 09:23 AM
No replies to this topic
#1
: post #1")
Costa
-
- Traders-Talk User
- 660 posts
Member
Posted 18 March 2012 - 09:23 AM
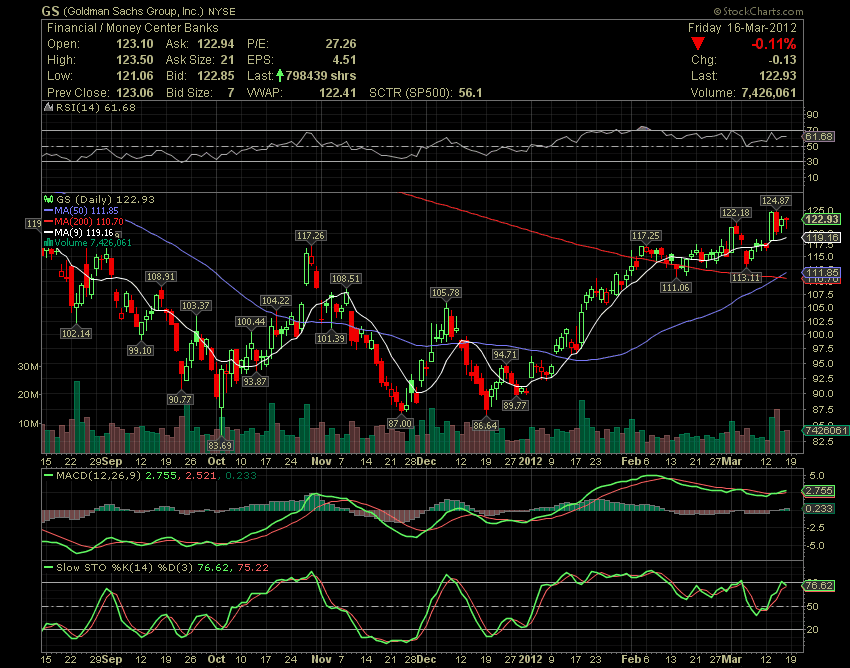
Pulled back to rising 9 day moving average. Looking to buy on strenght. Very interesting chart in terms of price candles, action and volume patterns. Stop loss below 117.26. In addition, technical chart shows very bullish signal as 50-day moving average has just crossed on top over 200-day moving average forming the Golden Cross.
Costa
AC Investor Blog Keep up to date by subscribing AC Investor Blog newsletter or RSS feed. You may wish to also follow me on Twitter.
AC Investor Blog Keep up to date by subscribing AC Investor Blog newsletter or RSS feed. You may wish to also follow me on Twitter.


