The Weekly MACD turned up. Now we're overbought and we have an Options Oscillator Sell, BUT, the fact is, a Weekly MACD Buy is good for at least 2 weeks of upside action. http://stockcharts.com/c-sc/sc?s=$SPX&p=W&yr=1&mn=0&dy=0&i=p94900592149&a=203438053&r=1341100253626.pngSo, I'd buy any weakness that might develop in here.Mark

Weekly MACD Buy
Started by
OEXCHAOS
, Jun 30 2012 06:51 PM
19 replies to this topic
#1

OEXCHAOS
-
- Admin
- 22,428 posts
Mark S. Young
Posted 30 June 2012 - 06:51 PM
Mark S Young
Wall Street Sentiment
Get a free trial here:
https://book.stripe....1aut29V5edgrS03
You can now follow me on X
#2
selecto
-

- Traders-Talk User
- 6,871 posts
Member
Posted 30 June 2012 - 07:11 PM
13/13 Still ticking: 
http://stockcharts.com/c-sc/sc?s=$SPX&p=W&yr=3&mn=0&dy=0&i=p29876482291&a=249108781&r=1341101344994.png
Somenody can draw up the weekly NASI - should look like uppa.
http://stockcharts.com/c-sc/sc?s=$SPX&p=W&yr=3&mn=0&dy=0&i=p29876482291&a=249108781&r=1341101344994.png
Somenody can draw up the weekly NASI - should look like uppa.
Edited by selecto, 30 June 2012 - 07:13 PM.
#3
Rogerdodger
-

- TT Member*
-

- 26,975 posts
Member
Posted 01 July 2012 - 08:38 AM
From Decision Point, Carl: New BUY Signal for S&P 500 Index
Mr T & Inger not impressed.
Mr T has been projecting a late June/early July bear T top and opines "The rally will fade quickly"
Gene Inger:
"The excitement will be short-lived - despite reluctantly reached agreements mostly 'in principle' (devil may be in details; but they matter for follow-through, that generally is not forthcoming, nor does this have anything to do with quick growth for Europe, and certainly not the U.S.), givenb late Friday statements that it may 'take a year or more' to set-up bond funds as 'in principle' (more).
This suggests that the Quarter's end was more short-covering and a relief rally extension; with little fundamentally achieved; even if Europe turned a corner (so we're not so negative as to be totally cynical; but even if they did investors likely discover what a slow process it will be). And as things are not so great; look at the reasons for Oil's rally; look at the risk of China's continued slowing' and for sure keep in mind that we allowed for a rally into early-mid July just seasonally and because we thought 'settlements' and 'window dressing' would firm this late in the Quarter, with very little follow-through in the beginning of the new Quarter."
Edited by Rogerdodger, 01 July 2012 - 08:52 AM.
"Nature's Failure to Function in a 'Predictable Way'... 500 years ago?"
BIGGEST SCIENCE SCANDAL EVER...Official records systematically 'adjusted'.
BIGGEST SCIENCE SCANDAL EVER...Official records systematically 'adjusted'.
#4
andr99
-

- Traders-Talk User
- 8,075 posts
Member
Posted 01 July 2012 - 11:33 AM
From Decision Point, Carl: New BUY Signal for S&P 500 Index
Mr T & Inger not impressed.
Mr T has been projecting a late June/early July bear T top and opines "The rally will fade quickly"
Gene Inger:
"The excitement will be short-lived - despite reluctantly reached agreements mostly 'in principle' (devil may be in details; but they matter for follow-through, that generally is not forthcoming, nor does this have anything to do with quick growth for Europe, and certainly not the U.S.), givenb late Friday statements that it may 'take a year or more' to set-up bond funds as 'in principle' (more).
This suggests that the Quarter's end was more short-covering and a relief rally extension; with little fundamentally achieved; even if Europe turned a corner (so we're not so negative as to be totally cynical; but even if they did investors likely discover what a slow process it will be). And as things are not so great; look at the reasons for Oil's rally; look at the risk of China's continued slowing' and for sure keep in mind that we allowed for a rally into early-mid July just seasonally and because we thought 'settlements' and 'window dressing' would firm this late in the Quarter, with very little follow-through in the beginning of the new Quarter."
great post Roger
forever and only a V-E-N-E-T-K-E-N - langbard
#5
Geomean
-

- Traders-Talk User
- 1,177 posts
Member
Posted 01 July 2012 - 11:36 AM
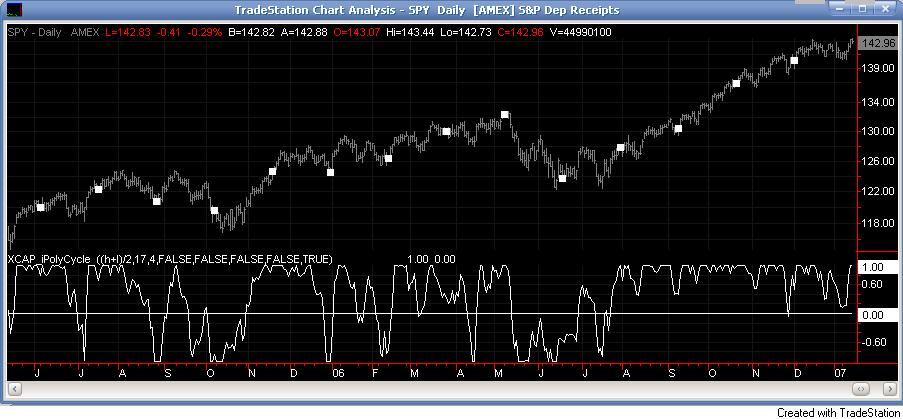
On the other hand, the averages closed at significant .618, .786, and / or TD Trend Factors (See $RUT, dashed horizontal lines on right of chart) harmonic points, and at TLs.
The weekly XCAP iPolyCycle (bottom oscillator than prints in blue, the light blue dots are the data points, the lines are smoothed) turned down on three of four indexes (and $Rut's last data point closed below the signal line), a significant warning in an up week.
Here's a Quad Chart followed by an explanation of the XCAP iPolyCycle indicator copied from the Trade Station forum on the subject (it's set below to Show Data and Fit, not RSI, Phase Shift, or Analytic Signal) :

Here's a description of XCAP by it's author posted in the Trade Station Support Forum along with it's ELD. Arbman would understand this probably better than anyone else I know.
XCAP_iPolyCycle
Author: Paul A. Griffin
January 16, 2007
Extrema Capital, 2007
Introduction
This indicator combines Legendre polynomials and analytic signal analysis. The result is a smooth definition of cycle period and an example relative strength indicator adapted to the cycle length. This analysis is performed without adding time lag by smoothing with moving averages.
This indicator displays the following:
a. The least squares fit of a polynomial to a DC subtracted time series - a best fit to a cycle.
b. The normalized Analytic Signal of the cycle (signal and quadrature).
c. The phase shift of the analytic signal per bar.
d. The period and half period lengths, in bars of the current cycle.
e. A relative strength indicator of the time series over the cycle length. That is, adaptive relative strength over the cycle length.
The relative strength indicator can be smoothed by increasing the length variable or decreasing the number of degrees of freedom used in the fit. Other adaptive indicators based upon the determined period and can be similarly constructed.
There is some new math here, so I have broken the story up into 5 Parts:
Part 1 The Polynomial Fit to a Cycle
Any time series can be decomposed into a orthogonal set of polynomials [1,2,3]. This decomposition lets you smooth the time series without adding extra lag associated with taking averages. I view this as the main reason to be using polynomial fits. You get an extra few bars of less lag.
Here are some good references:
[1] http://en.wikipedia....re_polynomials
[2] [inappropriate link deleted]
[3] Peter Seffen, "On Digital Smoothing Filters: A Brief Review of Closed Form Solutions and Two New Filter Approaches", Circuits Systems Signal Process, Vol. 5, No 2, 1986
For the analysis below, I decompose a time series into a low number of degrees of freedom and discard the zero mode to introduce smoothing.
That is:
time series => c_1 t + c_2 t^2 ... c_Max t^Max
This is defined as the cycle. By construction, the cycle does not have a zero mode, as c_0 is removed from the re-expansion. The data for the cycle and the fit of the cycle can be viewed by setting
ShowDataAndFit = TRUE;
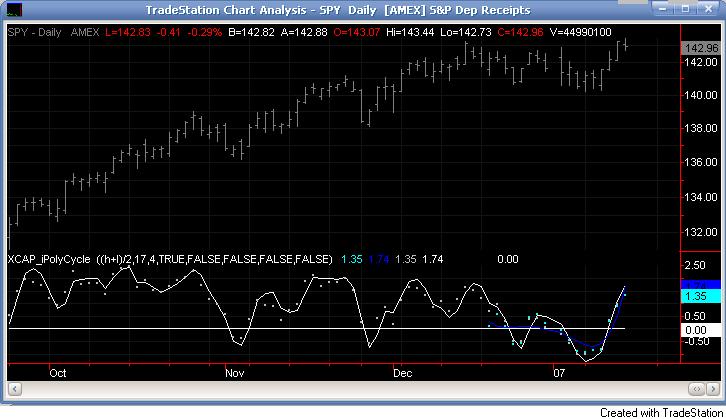
There, you will see the fit of the last bar as well as the time series of the leading edge of the fits. If you don't know what I mean by the "leading edge", please see some of the postings in [2]. The leading edges are in grayscale, and the data and fit of the last bar is in the blue colors. The data are the dots, the fits the lines.
I have choosen Length = 17 and Degree = 4 as the default. I am simply making sure by eye that the fit is reasonably good and degree 4 is the lowest polynomial that can represent a sine-like wave, and 17 is the smallest length that lets me calculate the Phase Shift (Part 3 below) using the Hilbert Transform of width = 7 (Part 2 below).
Depending upon the fit you make, you will capture different cycles in the data. A fit that is very "smooth" will not see smaller cycles, and a fit that is "choppy" will not see longer ones. The idea is to use the fit to try to suppress the smaller noise cycles while keeping larger signal cycles of interest to your trading.
Part 2 The Analytic Signal
Every time series has an Analytic Signal, defined by applying the Hilbert Transform to it. You can think of the original time series as amplitude * cosine(theta) and the transformed series, called the quadrature, can be thought of as amplitude * sine(theta). By taking the ratio, you can get the angle theta, and this is exactly what was done by John Ehlers in [4]. It lets you get a frequency out of the time series under consideration.
[4] http://www.amazon.co...p/0471405671
It also helps to have more references to understand this. There is a nice article in Wikipedia [5] on it. Read the part about the discrete Hilbert Transform:
[5] http://www.answers.c...rt-transform
Also, Answers.com has good information on the Hilbert Transform and links to other concepts:
[6] http://www.answers.c...rt-transform
If you really want to understand how to go from continuous to discrete, look up this article written by Richard Lyons:
[7] www.dspguru.com/info/tutor/QuadSignals.pdf
In the indicator below, I am calculating the normalized analytic signal, which can be written as:
s + i h where i is the imaginary number, and s^2 + h^2 = 1;
s= signal = cosine(theta)
h = hilbert transformed signal = quadrature = sine(theta)
The angle is therefore given by theta = arctan(h/s);
The analytic signal leading edge and the fit of the last bar of the cycle can be viewed by setting
ShowAnalyticSignal = TRUE;
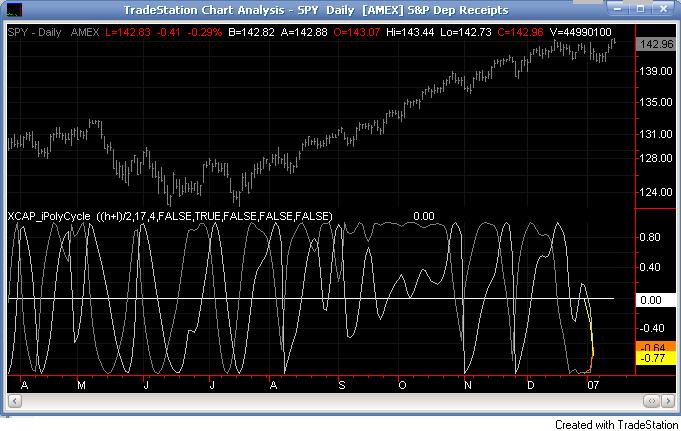
The leading edges are in grayscale fit to the last bar is in color. Light (yellow) is the
s term, and Dark (orange) is the quadrature (hilbert transform). Note that for every bar,
s^2 + h^2 = 1 , by construction.
I am using a width = 7 Hilbert transform, just like Ehlers. (But you can adjust it if you want.) This transform has a 7 bar lag. I have put the lag into the plot statements, so the cycle info should be quite good at displaying minima and maxima (extrema).
Part 3 The Phase Shift
The Phase shift is the amount of phase change from bar to bar. It is a discrete unitary transformation that takes s[1] + i h[1] to s + i h so this means that:
T = (s+ih)*(s[1]-ih[1]) , since s[1]*s[1] + h[1]*h[1] = 1.
writing it out, we find that
T = T1 + iT2
where
T1 = s*s[1] + h*h[1] and T2 = s*h[1]-h*s[1]
and the phase shift is given by PhaseShift = arctan(T2/T1).
Alas, I have no reference for this, all I doing is finding the rotation that takes the analytic signal at bar 1 to the analytic signal at bar 0. T is a transfer matrix, by the way.
Of interest is the PhaseShift from the closest two bars to the present, given by bar 7 and bar 8 since I am using a width=7 Hilbert transform, bar 7 is the earliest bar with an
analytic signal.
I store the phase shift from bar 7 to bar 8 as a timeseries called PhaseShift. It basically gives you the (7-bar delayed) leading edge the amount of phase angle change in the series. You can see it by setting
ShowPhaseShift=TRUE
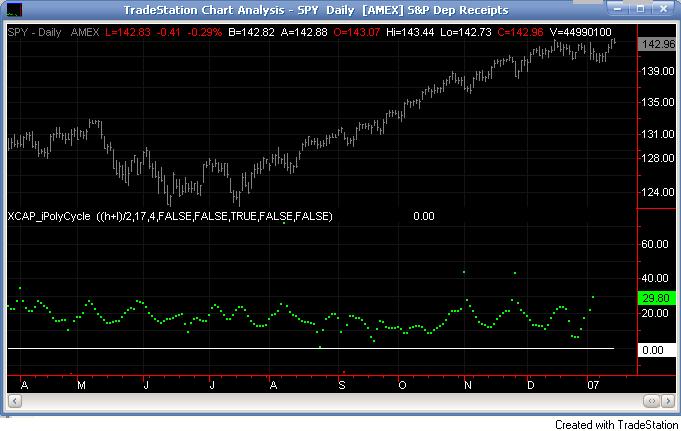
The green points are positve phase shifts and red points are negative phase shifts. On most charts I have looked at, the indicator is mostly green, but occasionally, the stock "retrogrades" and red appears. This happens when the cycle is "broken" and the cycle length starts to expand as a trend occurs. You might try setting the length to 31 with degree 4 to see this better.
Part 4 The Period and Half Period
The Period is the number of bars required to generate a sum of PhaseShifts equal to 360 degrees. The Half Period is the number of bars required to generate a sum of phase shifts equal to 180 degrees. It is usually not equal to 1/2 of the Period, by the way. The code to determine the period from the phase shifts is very simple:
Value1=0; Value2=0; while Value1 < barnumber and AbsValue(Value2) < 360 begin Value2 = Value2 + PhaseShift[Value1]; Value1 = Value1 + 1; end; Period = Value1;
select all
You can see the Period and Half Period in the indicator by setting
ShowPeriod=TRUE
In the image below, you will also see for comparison the Rocket 7 period indicator from the Ehlers Rocket Science book [4].
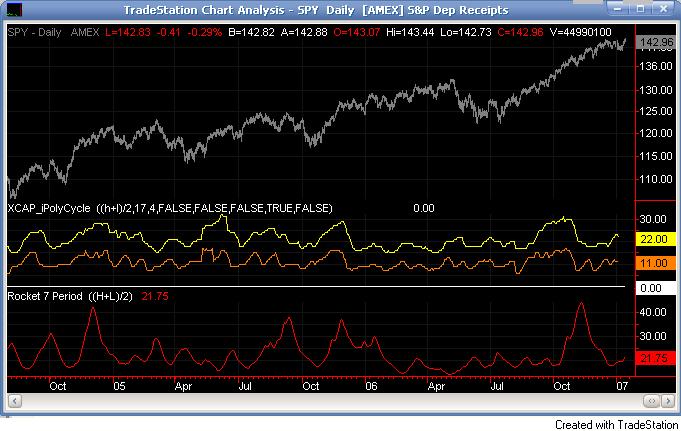
The period is sensitive to the Length and Degree values but not overly so. Any clever insights on this would be appreciated of course.
Part 5 The Relative Stength Indicator
The Relative Strength is just the current value of the series minus the minimum over the last cycle
divided by the maximum - minimum over the last cycle length and the 7-bar lag, normalized between +1 and -1:
RelativeStrength = -1 + 2*(Series-Min)/(Max-Min);
Therefore it tells you where the current bar is relative to the cycle. If you want to smooth the indicator, then extend the period and/or reduce the polynomial degree. You can see the Relative Strength by setting
ShowRelativeStrength = TRUE
It tells you where you are on a bar defined by the maximum and minimum values over the previous cycle.
Discussion
This is my first crack at combining Legendre polynomials fits with analytic signal theory to determine a smooth period without adding additional time lag from moving averages. There are many more ideas I have with using polynomial fits, but this is the one that motivated me originally to think about the least squares fit problem.
I should mention again that you can use the Period variable to adapt any length-based indicators to cycle fluxuations.
Well, thats all for now. Feedback and insights on how to make the code better are also always welcome. Just trying to make some progress,
--Paul Griffin
"eXcap"
The weekly XCAP iPolyCycle (bottom oscillator than prints in blue, the light blue dots are the data points, the lines are smoothed) turned down on three of four indexes (and $Rut's last data point closed below the signal line), a significant warning in an up week.
Here's a Quad Chart followed by an explanation of the XCAP iPolyCycle indicator copied from the Trade Station forum on the subject (it's set below to Show Data and Fit, not RSI, Phase Shift, or Analytic Signal) :
Here's a description of XCAP by it's author posted in the Trade Station Support Forum along with it's ELD. Arbman would understand this probably better than anyone else I know.
XCAP_iPolyCycle
Author: Paul A. Griffin
January 16, 2007
Extrema Capital, 2007
Introduction
This indicator combines Legendre polynomials and analytic signal analysis. The result is a smooth definition of cycle period and an example relative strength indicator adapted to the cycle length. This analysis is performed without adding time lag by smoothing with moving averages.
This indicator displays the following:
a. The least squares fit of a polynomial to a DC subtracted time series - a best fit to a cycle.
b. The normalized Analytic Signal of the cycle (signal and quadrature).
c. The phase shift of the analytic signal per bar.
d. The period and half period lengths, in bars of the current cycle.
e. A relative strength indicator of the time series over the cycle length. That is, adaptive relative strength over the cycle length.
The relative strength indicator can be smoothed by increasing the length variable or decreasing the number of degrees of freedom used in the fit. Other adaptive indicators based upon the determined period and can be similarly constructed.
There is some new math here, so I have broken the story up into 5 Parts:
Part 1 The Polynomial Fit to a Cycle
Any time series can be decomposed into a orthogonal set of polynomials [1,2,3]. This decomposition lets you smooth the time series without adding extra lag associated with taking averages. I view this as the main reason to be using polynomial fits. You get an extra few bars of less lag.
Here are some good references:
[1] http://en.wikipedia....re_polynomials
[2] [inappropriate link deleted]
[3] Peter Seffen, "On Digital Smoothing Filters: A Brief Review of Closed Form Solutions and Two New Filter Approaches", Circuits Systems Signal Process, Vol. 5, No 2, 1986
For the analysis below, I decompose a time series into a low number of degrees of freedom and discard the zero mode to introduce smoothing.
That is:
time series => c_1 t + c_2 t^2 ... c_Max t^Max
This is defined as the cycle. By construction, the cycle does not have a zero mode, as c_0 is removed from the re-expansion. The data for the cycle and the fit of the cycle can be viewed by setting
ShowDataAndFit = TRUE;
There, you will see the fit of the last bar as well as the time series of the leading edge of the fits. If you don't know what I mean by the "leading edge", please see some of the postings in [2]. The leading edges are in grayscale, and the data and fit of the last bar is in the blue colors. The data are the dots, the fits the lines.
I have choosen Length = 17 and Degree = 4 as the default. I am simply making sure by eye that the fit is reasonably good and degree 4 is the lowest polynomial that can represent a sine-like wave, and 17 is the smallest length that lets me calculate the Phase Shift (Part 3 below) using the Hilbert Transform of width = 7 (Part 2 below).
Depending upon the fit you make, you will capture different cycles in the data. A fit that is very "smooth" will not see smaller cycles, and a fit that is "choppy" will not see longer ones. The idea is to use the fit to try to suppress the smaller noise cycles while keeping larger signal cycles of interest to your trading.
Part 2 The Analytic Signal
Every time series has an Analytic Signal, defined by applying the Hilbert Transform to it. You can think of the original time series as amplitude * cosine(theta) and the transformed series, called the quadrature, can be thought of as amplitude * sine(theta). By taking the ratio, you can get the angle theta, and this is exactly what was done by John Ehlers in [4]. It lets you get a frequency out of the time series under consideration.
[4] http://www.amazon.co...p/0471405671
It also helps to have more references to understand this. There is a nice article in Wikipedia [5] on it. Read the part about the discrete Hilbert Transform:
[5] http://www.answers.c...rt-transform
Also, Answers.com has good information on the Hilbert Transform and links to other concepts:
[6] http://www.answers.c...rt-transform
If you really want to understand how to go from continuous to discrete, look up this article written by Richard Lyons:
[7] www.dspguru.com/info/tutor/QuadSignals.pdf
In the indicator below, I am calculating the normalized analytic signal, which can be written as:
s + i h where i is the imaginary number, and s^2 + h^2 = 1;
s= signal = cosine(theta)
h = hilbert transformed signal = quadrature = sine(theta)
The angle is therefore given by theta = arctan(h/s);
The analytic signal leading edge and the fit of the last bar of the cycle can be viewed by setting
ShowAnalyticSignal = TRUE;
The leading edges are in grayscale fit to the last bar is in color. Light (yellow) is the
s term, and Dark (orange) is the quadrature (hilbert transform). Note that for every bar,
s^2 + h^2 = 1 , by construction.
I am using a width = 7 Hilbert transform, just like Ehlers. (But you can adjust it if you want.) This transform has a 7 bar lag. I have put the lag into the plot statements, so the cycle info should be quite good at displaying minima and maxima (extrema).
Part 3 The Phase Shift
The Phase shift is the amount of phase change from bar to bar. It is a discrete unitary transformation that takes s[1] + i h[1] to s + i h so this means that:
T = (s+ih)*(s[1]-ih[1]) , since s[1]*s[1] + h[1]*h[1] = 1.
writing it out, we find that
T = T1 + iT2
where
T1 = s*s[1] + h*h[1] and T2 = s*h[1]-h*s[1]
and the phase shift is given by PhaseShift = arctan(T2/T1).
Alas, I have no reference for this, all I doing is finding the rotation that takes the analytic signal at bar 1 to the analytic signal at bar 0. T is a transfer matrix, by the way.
Of interest is the PhaseShift from the closest two bars to the present, given by bar 7 and bar 8 since I am using a width=7 Hilbert transform, bar 7 is the earliest bar with an
analytic signal.
I store the phase shift from bar 7 to bar 8 as a timeseries called PhaseShift. It basically gives you the (7-bar delayed) leading edge the amount of phase angle change in the series. You can see it by setting
ShowPhaseShift=TRUE
The green points are positve phase shifts and red points are negative phase shifts. On most charts I have looked at, the indicator is mostly green, but occasionally, the stock "retrogrades" and red appears. This happens when the cycle is "broken" and the cycle length starts to expand as a trend occurs. You might try setting the length to 31 with degree 4 to see this better.
Part 4 The Period and Half Period
The Period is the number of bars required to generate a sum of PhaseShifts equal to 360 degrees. The Half Period is the number of bars required to generate a sum of phase shifts equal to 180 degrees. It is usually not equal to 1/2 of the Period, by the way. The code to determine the period from the phase shifts is very simple:
Value1=0; Value2=0; while Value1 < barnumber and AbsValue(Value2) < 360 begin Value2 = Value2 + PhaseShift[Value1]; Value1 = Value1 + 1; end; Period = Value1;
select all
You can see the Period and Half Period in the indicator by setting
ShowPeriod=TRUE
In the image below, you will also see for comparison the Rocket 7 period indicator from the Ehlers Rocket Science book [4].
The period is sensitive to the Length and Degree values but not overly so. Any clever insights on this would be appreciated of course.
Part 5 The Relative Stength Indicator
The Relative Strength is just the current value of the series minus the minimum over the last cycle
divided by the maximum - minimum over the last cycle length and the 7-bar lag, normalized between +1 and -1:
RelativeStrength = -1 + 2*(Series-Min)/(Max-Min);
Therefore it tells you where the current bar is relative to the cycle. If you want to smooth the indicator, then extend the period and/or reduce the polynomial degree. You can see the Relative Strength by setting
ShowRelativeStrength = TRUE
It tells you where you are on a bar defined by the maximum and minimum values over the previous cycle.
Discussion
This is my first crack at combining Legendre polynomials fits with analytic signal theory to determine a smooth period without adding additional time lag from moving averages. There are many more ideas I have with using polynomial fits, but this is the one that motivated me originally to think about the least squares fit problem.
I should mention again that you can use the Period variable to adapt any length-based indicators to cycle fluxuations.
Well, thats all for now. Feedback and insights on how to make the code better are also always welcome. Just trying to make some progress,
--Paul Griffin
"eXcap"
Edited by Geomean, 01 July 2012 - 11:40 AM.
Opportunity knocks on your door every day-answer it.
#6
IYB
-

- TT Patron+
- 7,157 posts
Member
Posted 01 July 2012 - 02:49 PM
The Weekly MACD turned up.
Weekly MACD turned up (as Mark notes), Selecto's Weekly Stochs in buy mode, IBD is on confirmed uptrend, Seven Sentinels are on confirmed uptrend (Since June 10, 2012), and I'm relatively certain NAV's price indicators are in "long" mode. We can speculate till the cows come home about "when and where" we think it will top or turn down....but that's an unknown and is somewhere in the future. For right here, right now (which is where we all actually trade)...the trend is up, the trade is long. Let others trade based on what they "think" will be. I choose to trade on what IS. Just my humble trading philosophy.13/13 Still ticking:
 A good trading week to all, D...
http://stockcharts.com/c-sc/sc?s=$NYSI&p=D&yr=0&mn=4&dy=0&i=p95928104931&a=270840185&r=824.png
Edited by IYB, 01 July 2012 - 02:53 PM.
Men, it has been well said, think in herds; it will be seen that they go mad in herds, while they only recover their senses slowly, one by one. ― Charles Mackay, Extraordinary Popular Delusions and the Madness of Crowds
#7
andr99
-
- Traders-Talk User
- 8,075 posts
Member
Posted 01 July 2012 - 02:57 PM
The Weekly MACD turned up.
MACD turned up, Selecto's Weekly Stochs in buy mode, IBD is on confirmed uptrend, Seven Sentinels are on confirmed uptrend (Since June 10, 2012), and I'm relatively certain NAV's price indicators are in "long" mode. We can speculate till the cows come home about "when and where" we think it will top or turn down....but that's an unknown and is somewhere in the future. For right here, right now (which is where we all actually trade)...the trend is up, the trade is long. Let others trade based on what they "think" will be. I choose to trade on what IS. Just my humble trading philosophy.13/13 Still ticking:
http://stockcharts.com/c-sc/sc?s=$NYSI&p=D&yr=0&mn=4&dy=0&i=p95928104931&a=270840185&r=824.png
your buy signal came 50 points higher than the bottom, a sell signal in your trading system could come 50 points lower than the top. So the trend is up until it becomes down, a bit later.
forever and only a V-E-N-E-T-K-E-N - langbard
#8
selecto
-
- Traders-Talk User
- 6,871 posts
Member
Posted 01 July 2012 - 04:03 PM
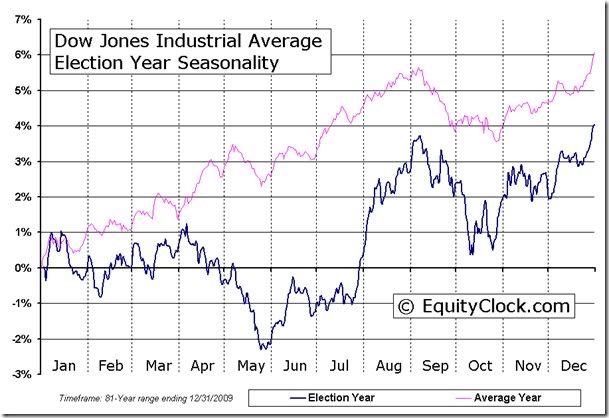
Then there is seasonality. Last couple of months have tracked quite well:
#9
OEXCHAOS
-
- Admin
- 22,428 posts
Mark S. Young
Posted 01 July 2012 - 04:10 PM
Selecto,
I'm kinda thinking that myself, though perhaps without the same amplitude.
M
Mark S Young
Wall Street Sentiment
Get a free trial here:
https://book.stripe....1aut29V5edgrS03
You can now follow me on X
#10
IndexTrader
-

- TT Patron+
- 7,694 posts
Member
Posted 01 July 2012 - 05:46 PM
Weekly MACD turned up (as Mark notes), Selecto's Weekly Stochs in buy mode, IBD is on confirmed uptrend, Seven Sentinels are on confirmed uptrend (Since June 10, 2012), and I'm relatively certain NAV's price indicators are in "long" mode. We can speculate till the cows come home about "when and where" we think it will top or turn down....but that's an unknown and is somewhere in the future. For right here, right now (which is where we all actually trade)...the trend is up, the trade is long. Let others trade based on what they "think" will be. I choose to trade on what IS. Just my humble trading philosophy.
Don: Correct me if I'm wrong, but I'm under the distinct impression that all of your posts for the last couple or three weeks were bearish. What gives? That said, I agree with you about the present trend.
IT
Edited by IndexTrader, 01 July 2012 - 05:47 PM.


